How to Create Burndown Charts in Coda From Trello Data
How to Create Burndown Charts in Coda From Trello Data: step-by-step guide
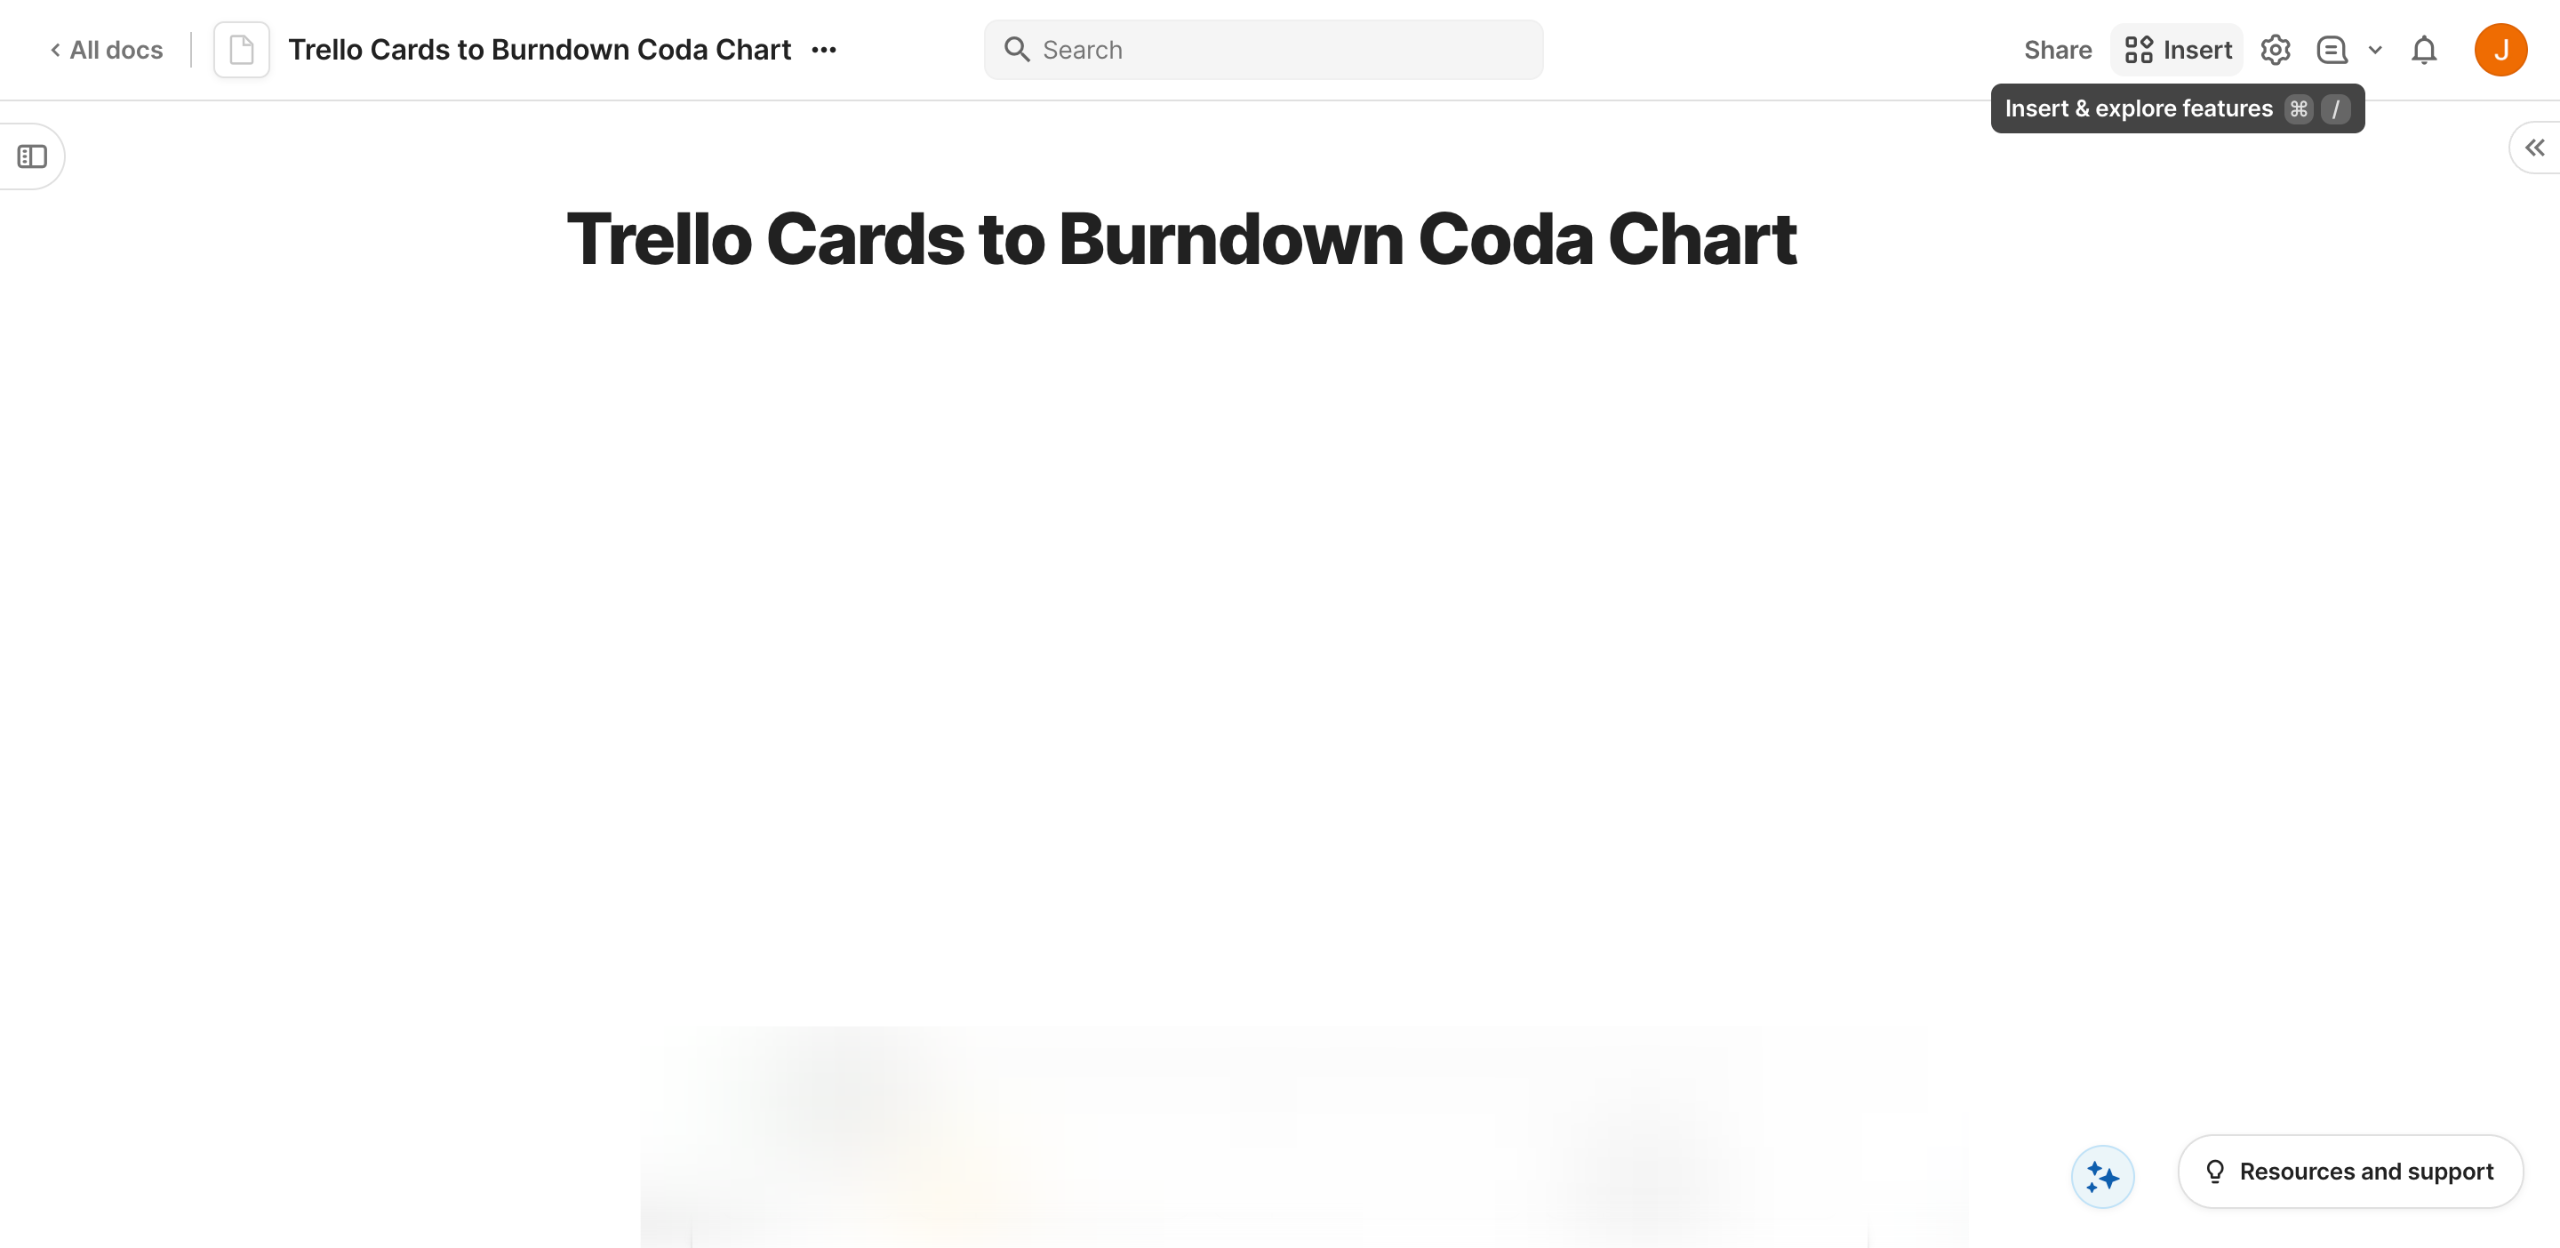
Inside your Coda doc, head over to the top-right corner and click 'Insert'.
Tap the 'Packs' tab to proceed.
After that, find and select 'Trello Deluxe'.
Select 'Cards' from the list of options, then drag it to the main workspace for further customization.
Next, tap 'Connect an Account'.
Provide the API credentials associated with your Trello account. Enter them into their respective input fields.
Subsequently, click 'Continue'.
Tap 'Complete Setup' to enable the connection and start creating the chart.
Click 'Choose What to Sync'.
Following that, navigate to the right-side panel and click the 'Workspace' menu. Choose the Trello workspace that contains the cards you want to use.
Subsequently, tap 'Sync Now' to continue.
At last, it's time to convert your Trello cards into a Burndown chart. To get started, click the drop-down arrow next to the 'Refresh' button.
Tap 'Settings' afterwards.
Click 'More' to view other available format options.
Choose 'Chart' from the list of options.
Following that, click 'Chart Display' to customize your chart.
As for the Chart Type, select 'Line Chart'.
Select 'Count' as the Card Values.
Configure other available settings to customize the content and appearance of your Burndown chart.
After completing these steps, your Coda burndown chart will be created based on the selected Trello data.
Quick answer: To visualize Trello data as burndown charts, insert the Trello Deluxe pack into Coda, connect your Trello account using API credentials, sync your workspace cards, and configure the chart format by selecting Line Chart and setting Card Values to Count.
About this Trello tutorial
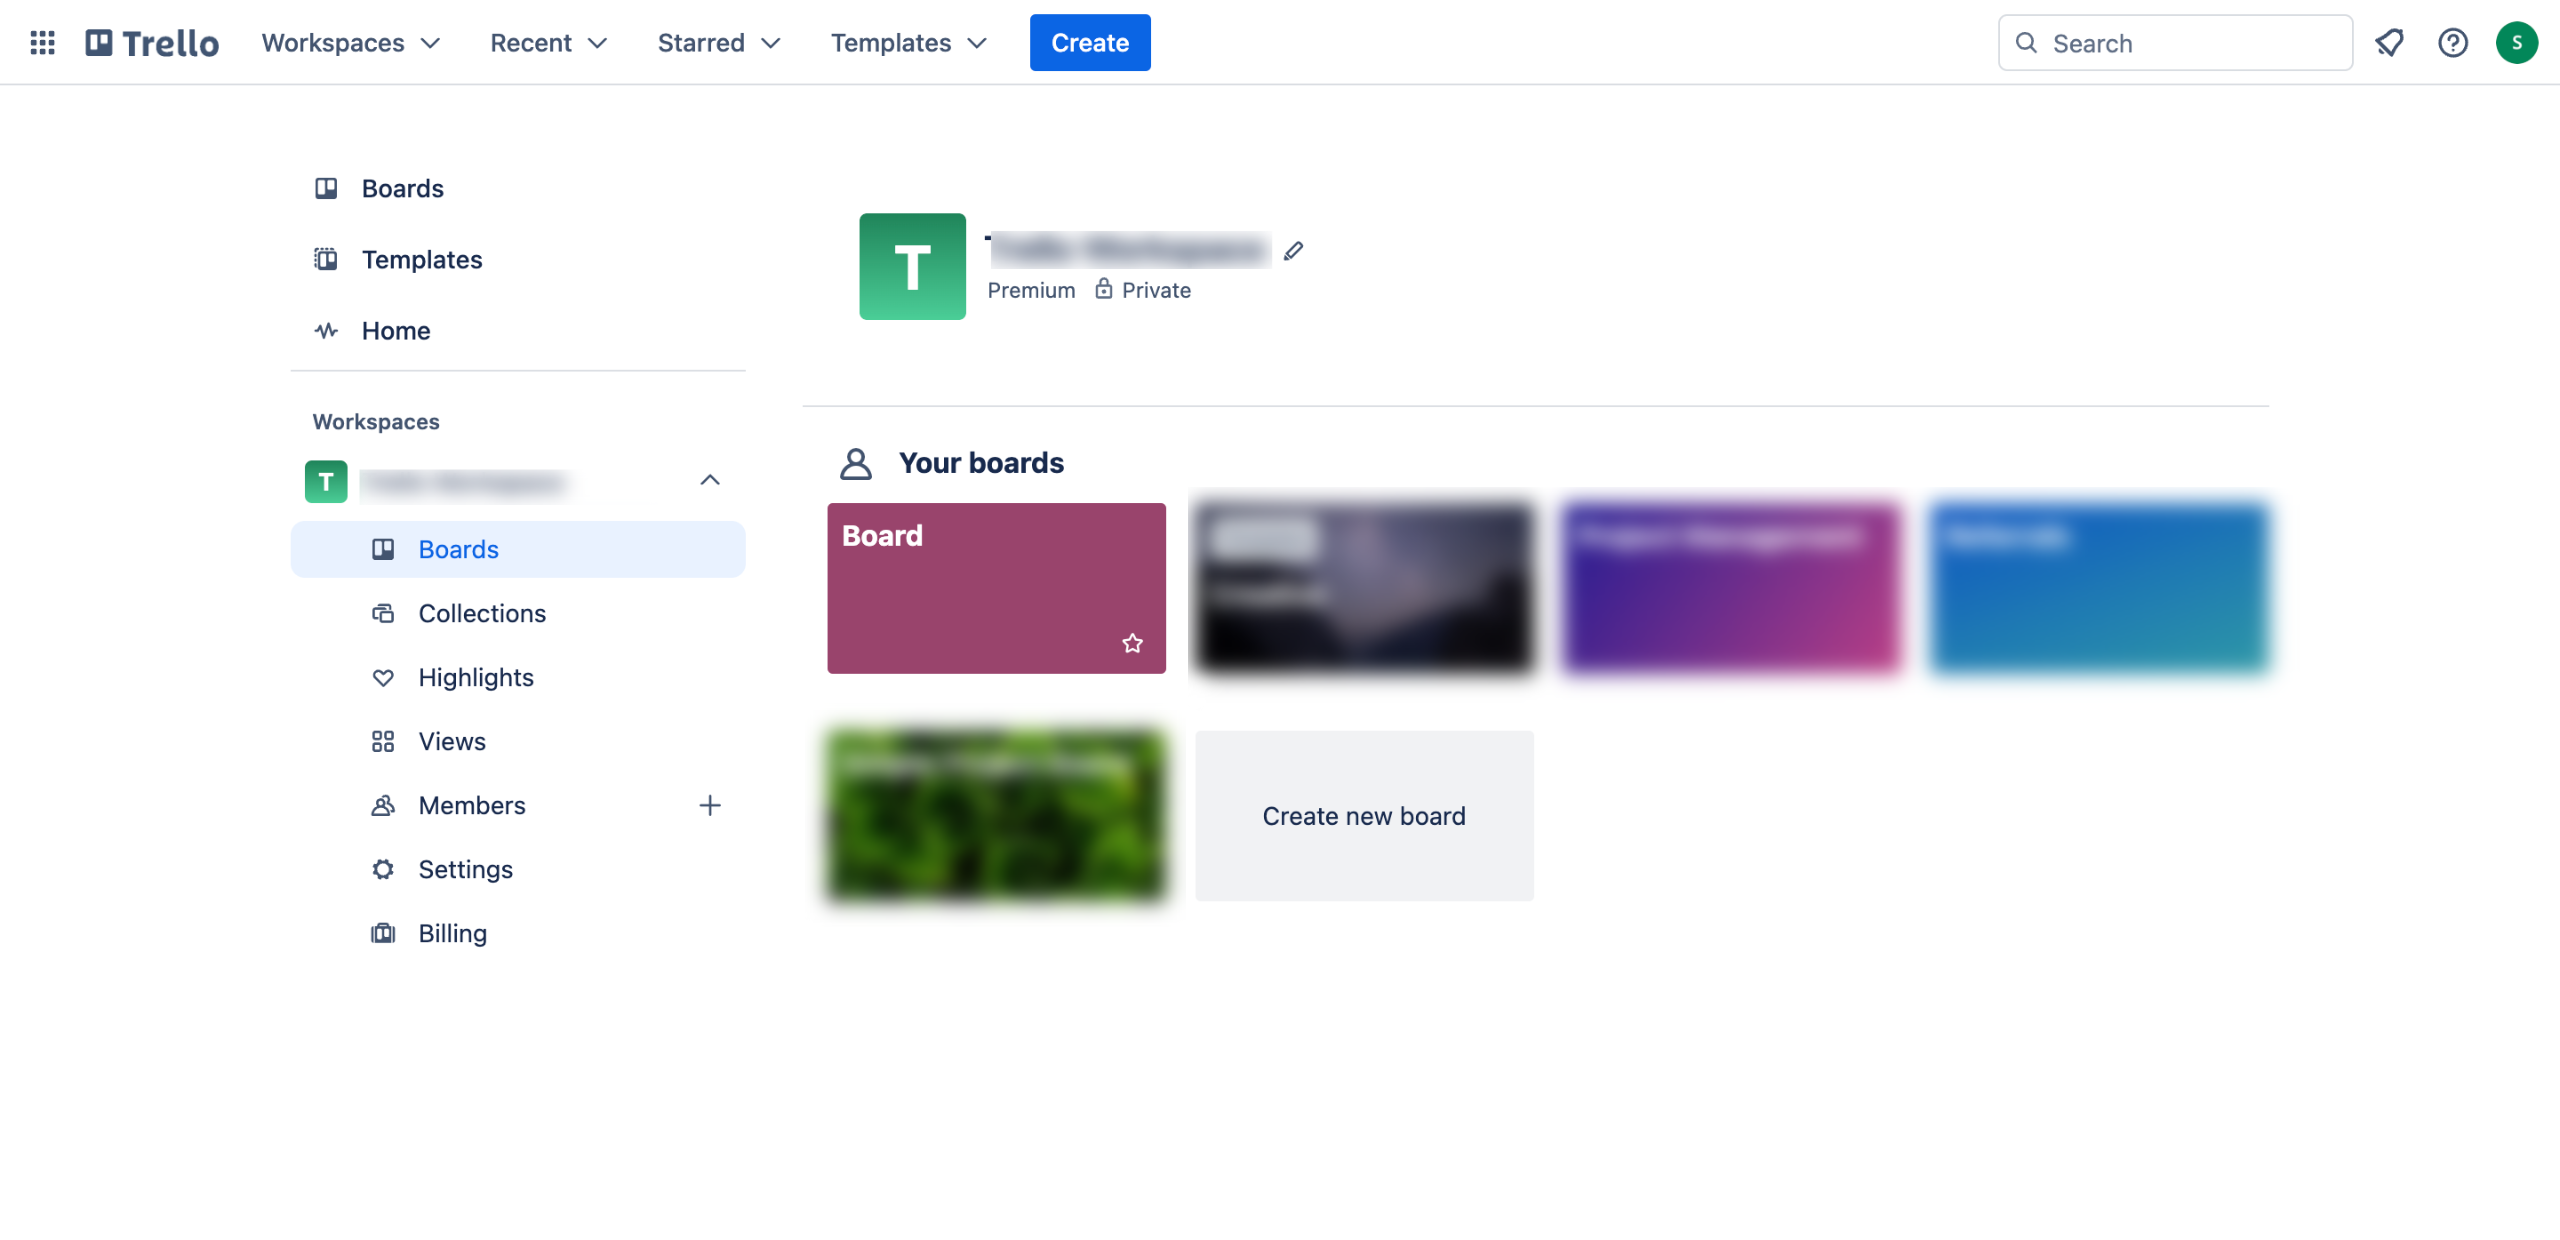
Convert Trello cards into a Coda burndown chart by connecting your account, syncing workspace data, and configuring line chart settings. This guide shows how to create Burndown Charts in Coda From Trello Data in 20 steps, starting with "Inside your Coda doc, head over to the top-right corner and click 'Insert'" and finishing with "After completing these steps, your Coda burndown chart will be created based on the sel...". The interactive demo above is a click-through copy of the real Trello interface, so you can rehearse each step before doing it in your own account.
Frequently asked questions
How many steps does it take to create Burndown Charts in Coda From Trello Data?
20 steps. Each one is listed in order above, and the demo highlights exactly where to click.
Can I try it without changing my own account?
Yes. Clicking through the demo doesn't touch your Trello data or settings. Once you know the flow, repeat it in your own workspace.
This tutorial is filed under Trello and Coda. Related guides: How to Import Trello Board to ClickUp, How to Integrate Coda with Trello and How to Integrate Evernote with Trello. Last reviewed 05 Oct 2026.

Create your first interactive demo in minutes
No credit card required • Start building today