How to Create a Map in Power BI
- George Apostolov
How to Create a Map in Power BI: step-by-step guide
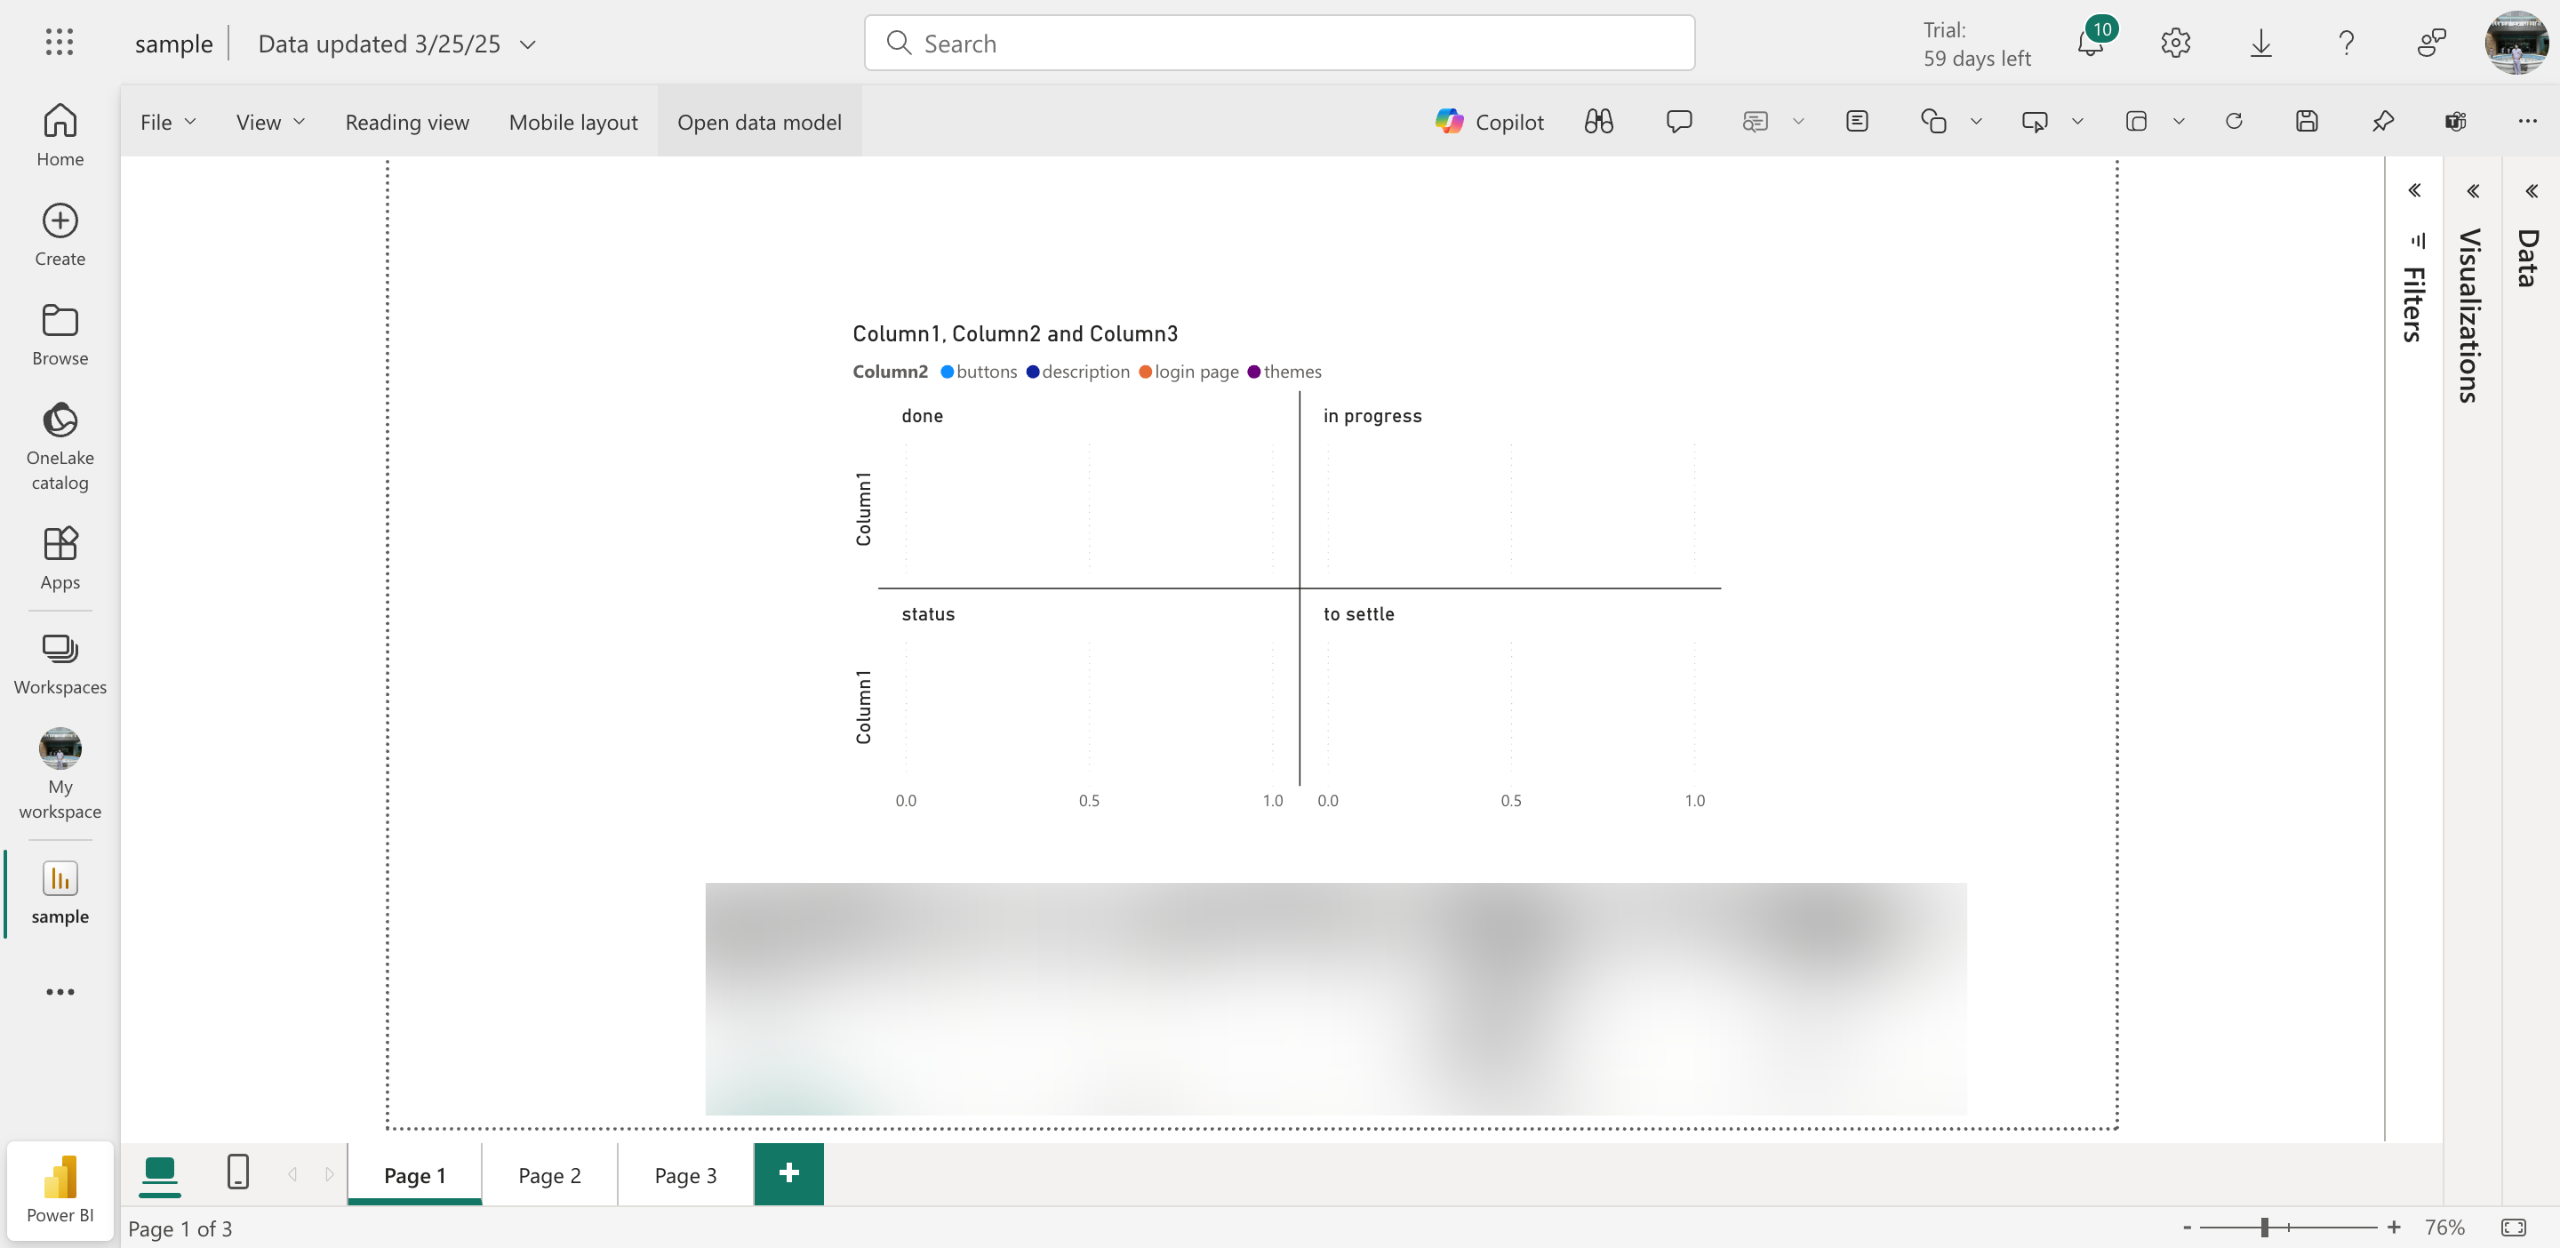
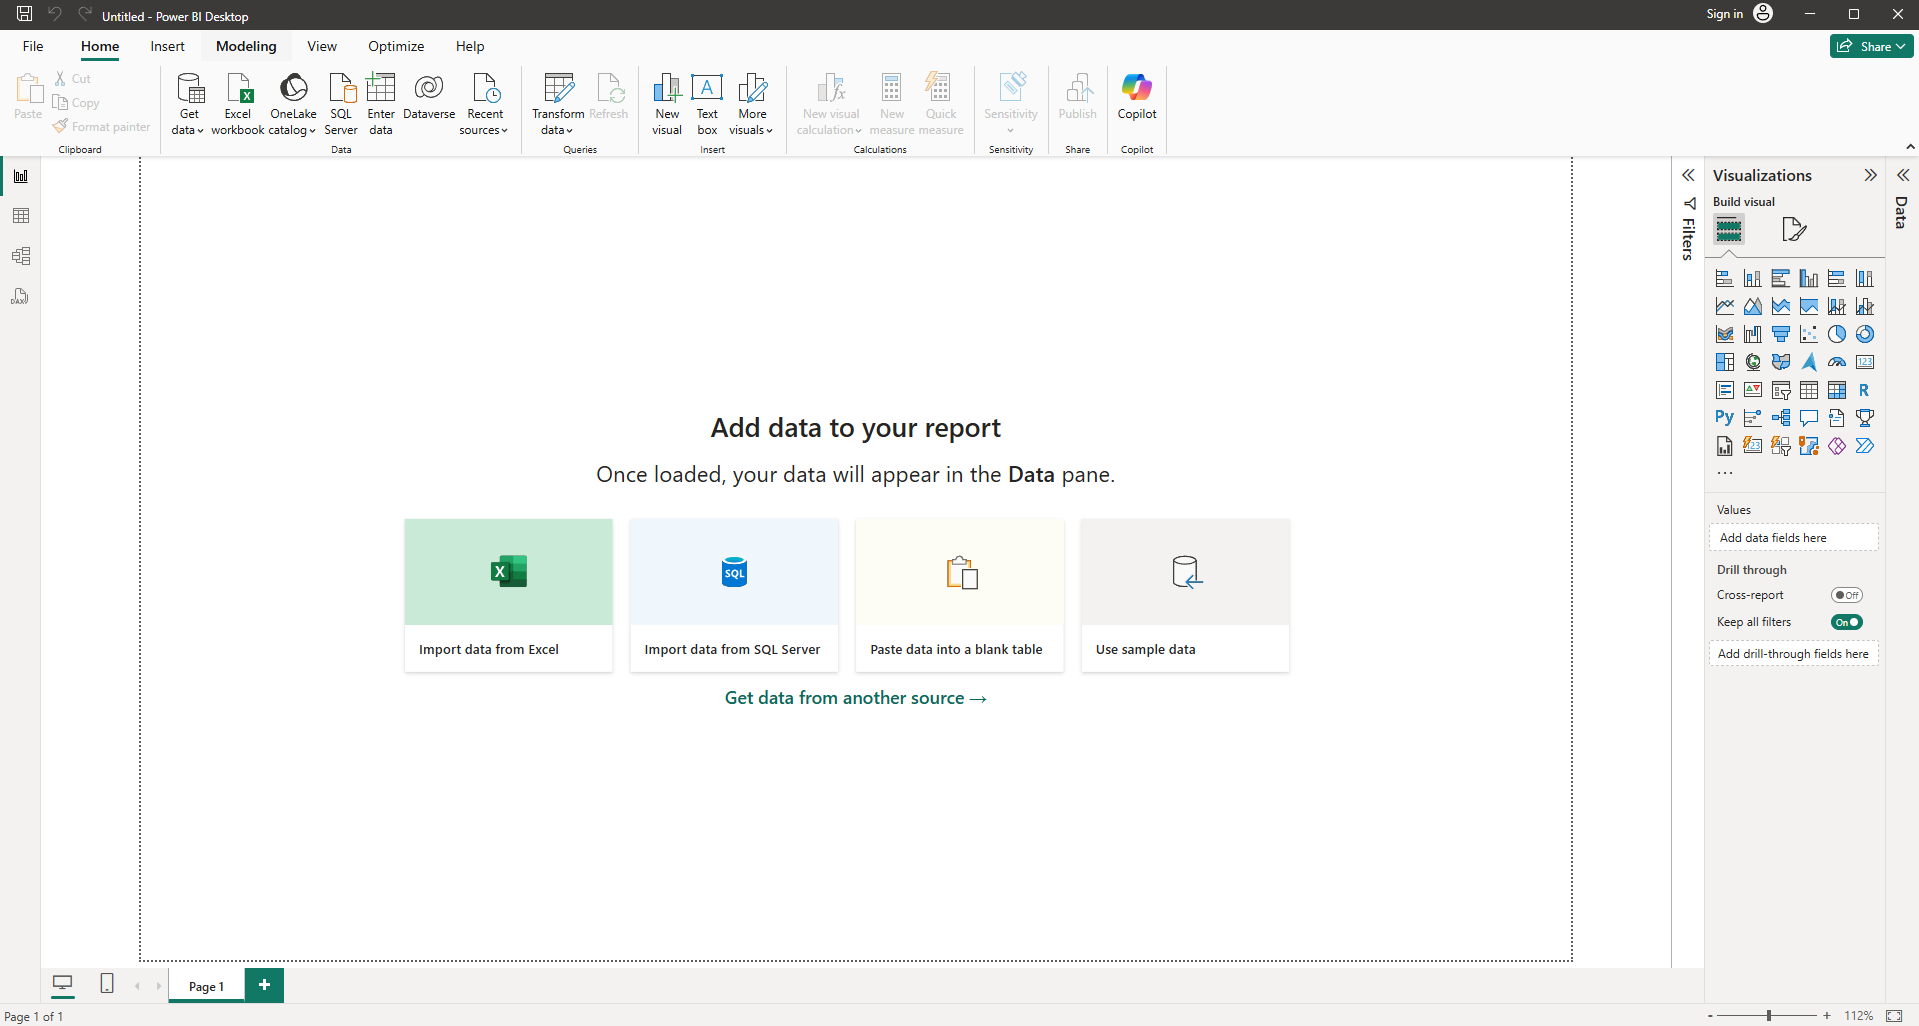
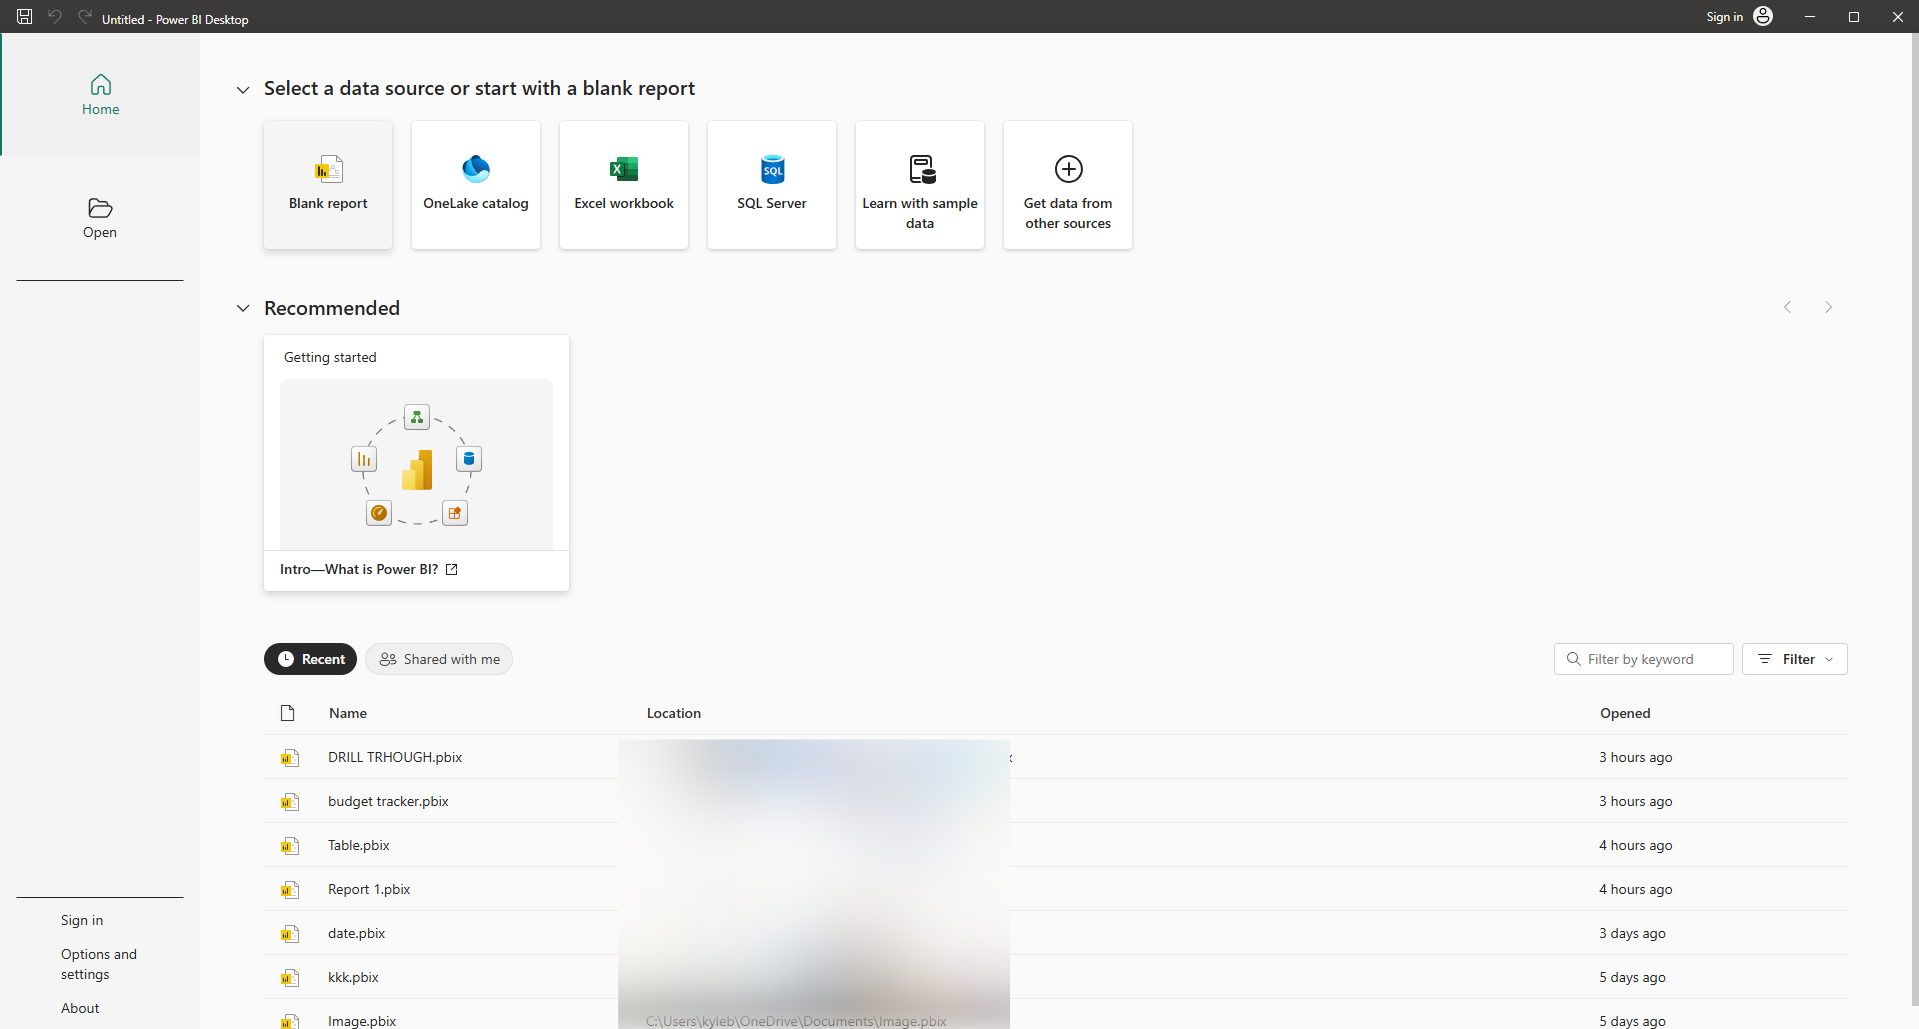
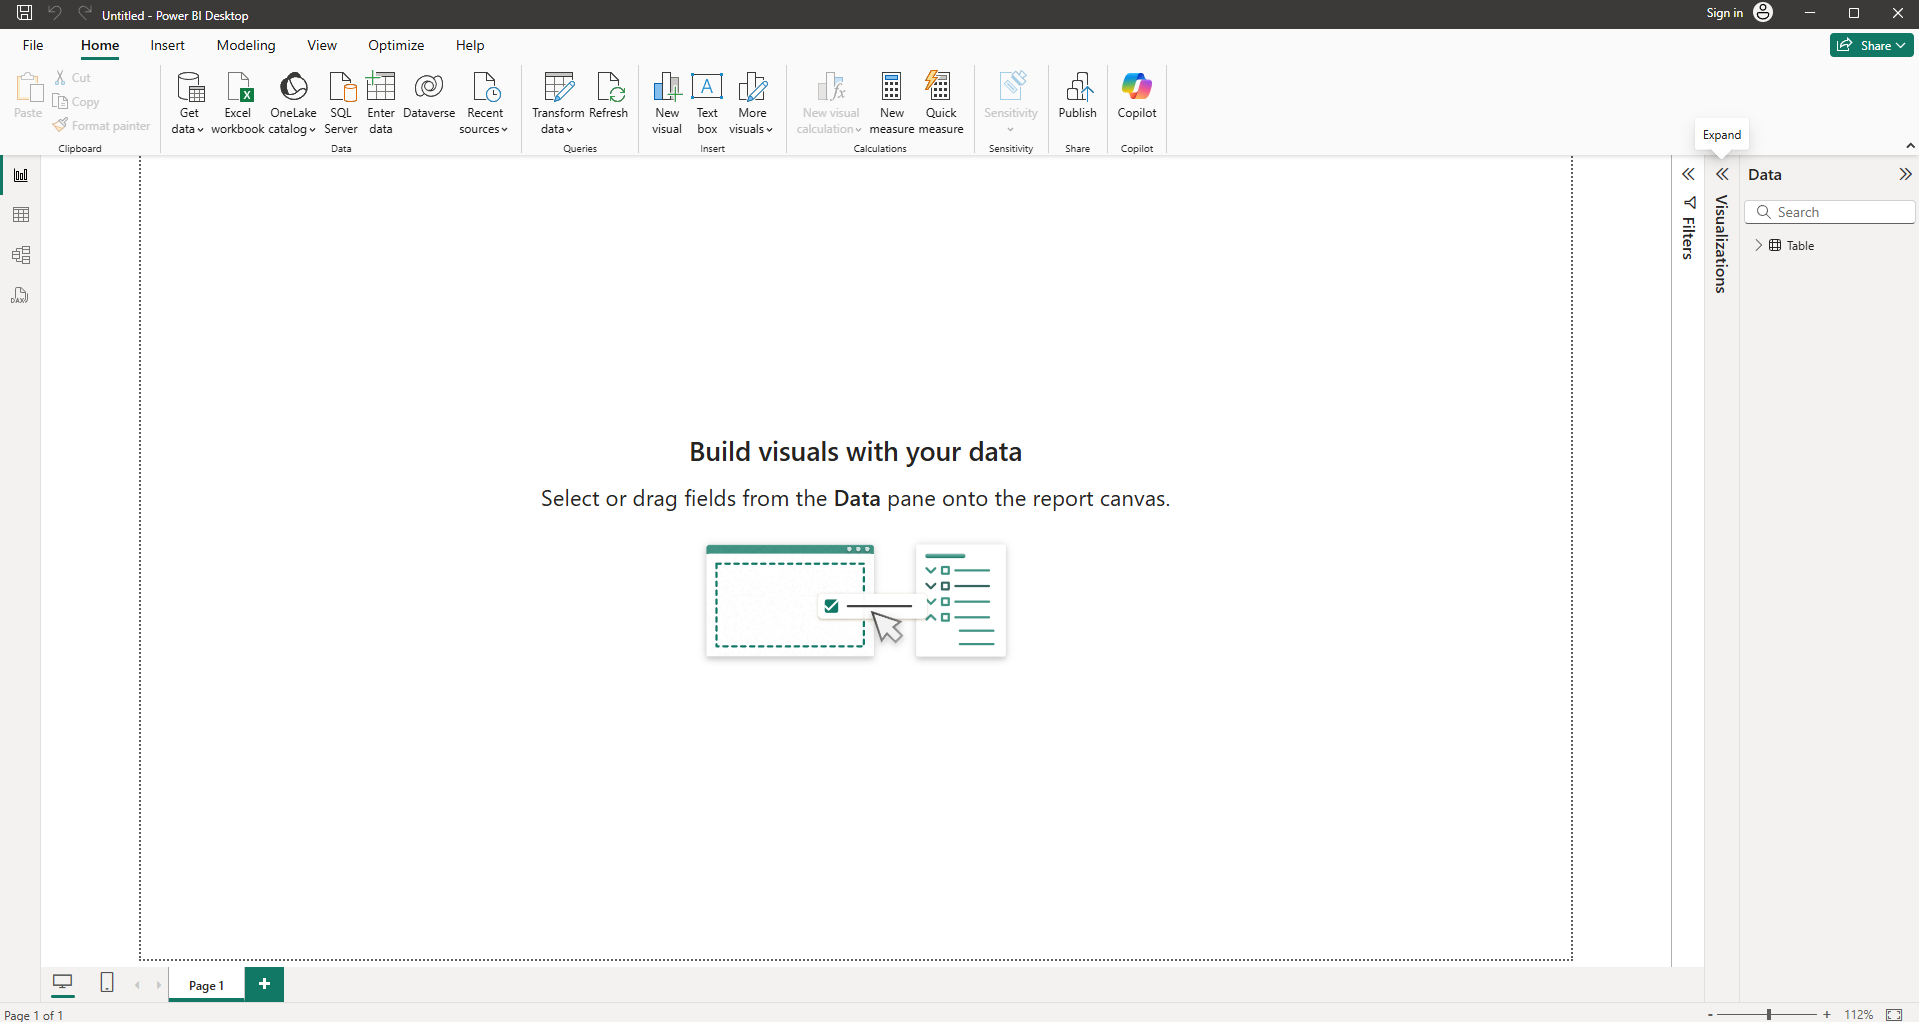
Open Power BI Desktop. Go to the 'Visualizations' pane.
In the 'Visualizations' pane, click the 'Map' icon.
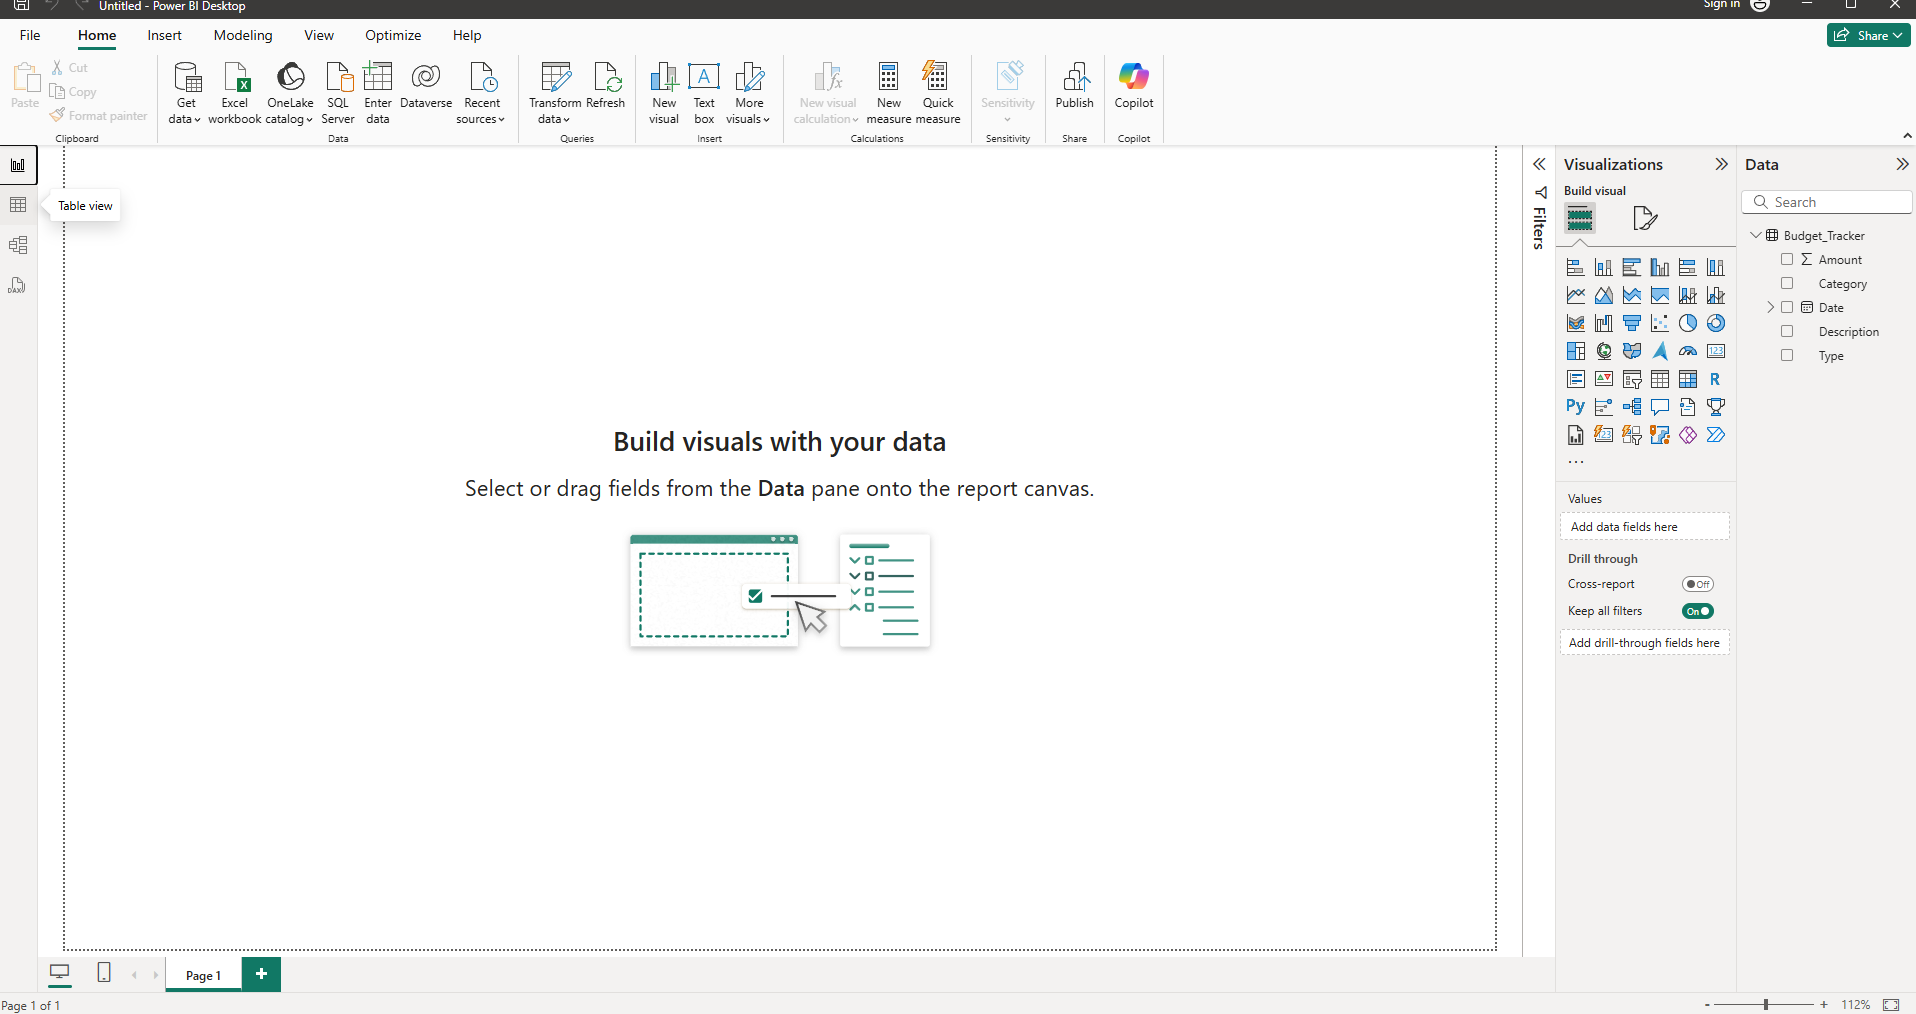
A blank map visual appears on the report canvas.
Drag fields to the appropriate buckets.
That's it! You have successfully created a map in Power BI.
Quick answer: To create a map in Power BI Desktop, open the app, go to the Visualizations pane, and click the Map icon. Next, a blank map visual appears on the report canvas. Finally, drag fields to the appropriate buckets to complete your map.
About this Power BI tutorial
Add a map visual to your report canvas in Power BI Desktop by selecting the map icon and dragging fields into the correct buckets. This guide shows how to create a Map in Power BI in 5 steps, starting with "Open Power BI Desktop. Go to the 'Visualizations' pane" and finishing with "That's it! You have successfully created a map in Power BI". The interactive demo above is a click-through copy of the real Power BI interface, so you can rehearse each step before doing it in your own account.
Frequently asked questions
How many steps does it take to create a Map in Power BI?
5 steps. Each one is listed in order above, and the demo highlights exactly where to click.
Can I try it without changing my own account?
Yes. Clicking through the demo doesn't touch your Power BI data or settings. Once you know the flow, repeat it in your own workspace.
This tutorial is filed under Power BI. Related guides: How to Create a Measure in Power BI, How to Create a Measure Table in Power BI and How to Create a New Dashboard in Power BI. Last reviewed 05 Oct 2026.

Create your first interactive demo in minutes
No credit card required • Start building today