How to Design a Dashboard in Power BI
- George Apostolov
How to Design a Dashboard in Power BI: step-by-step guide
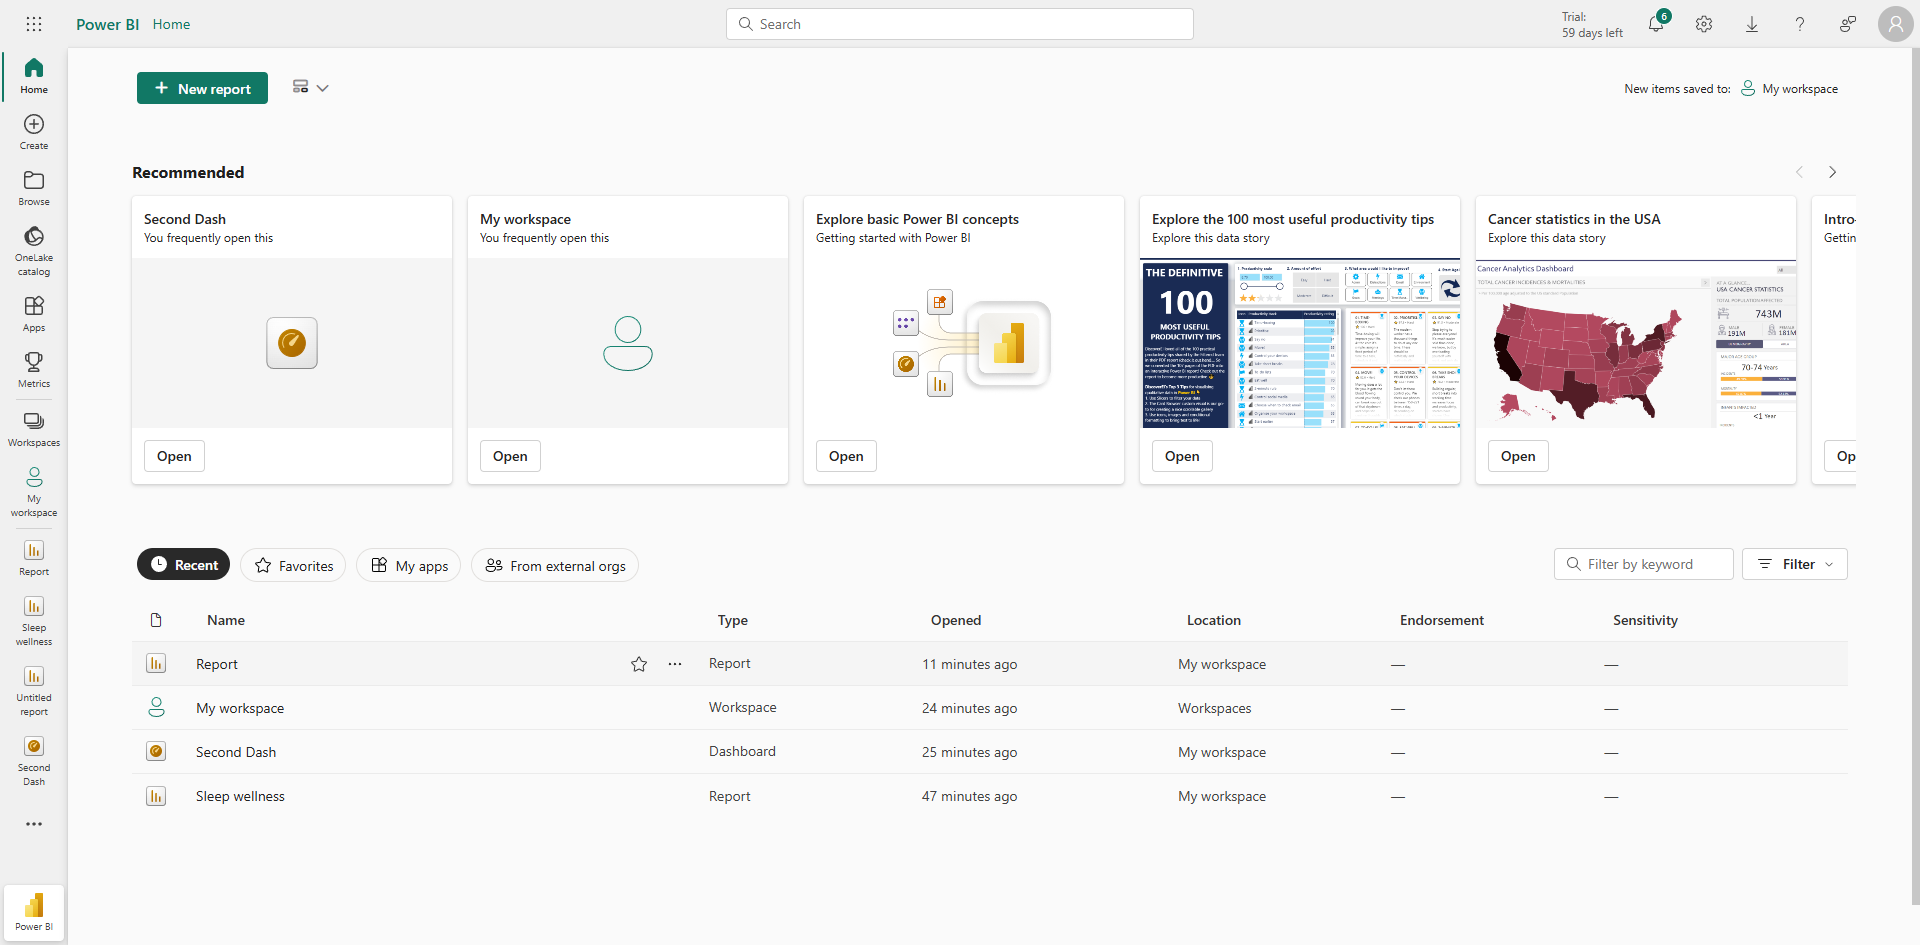
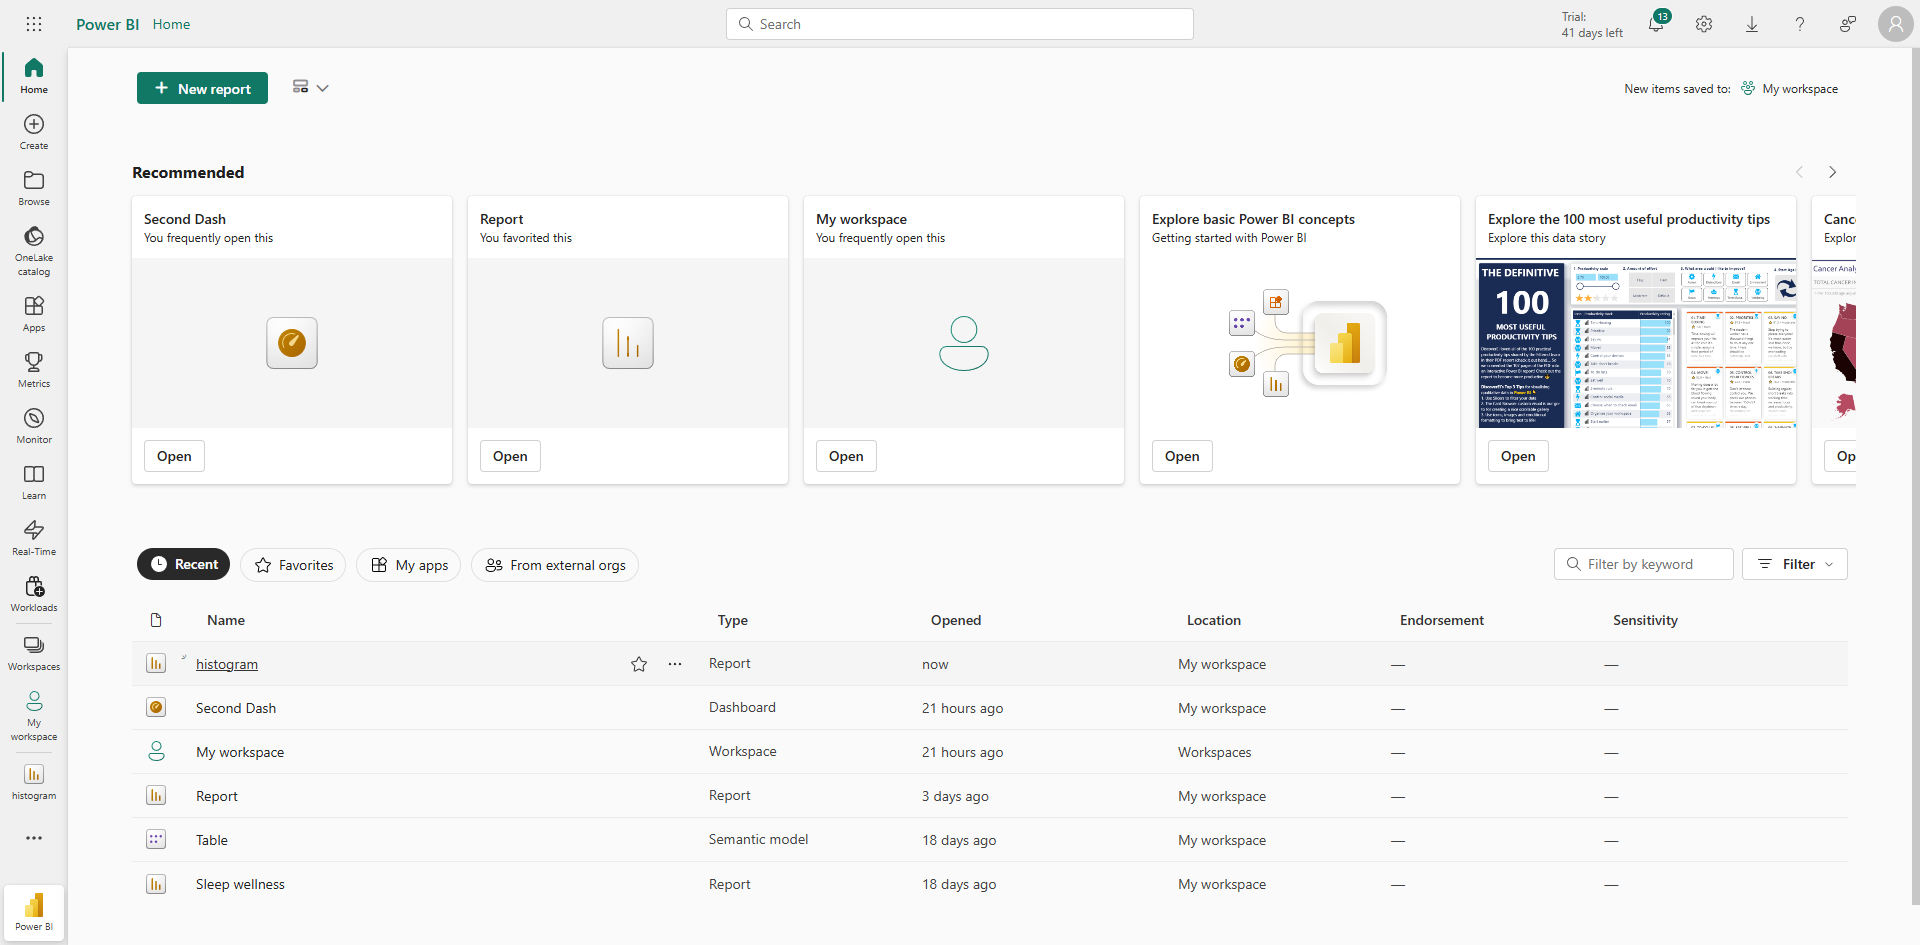
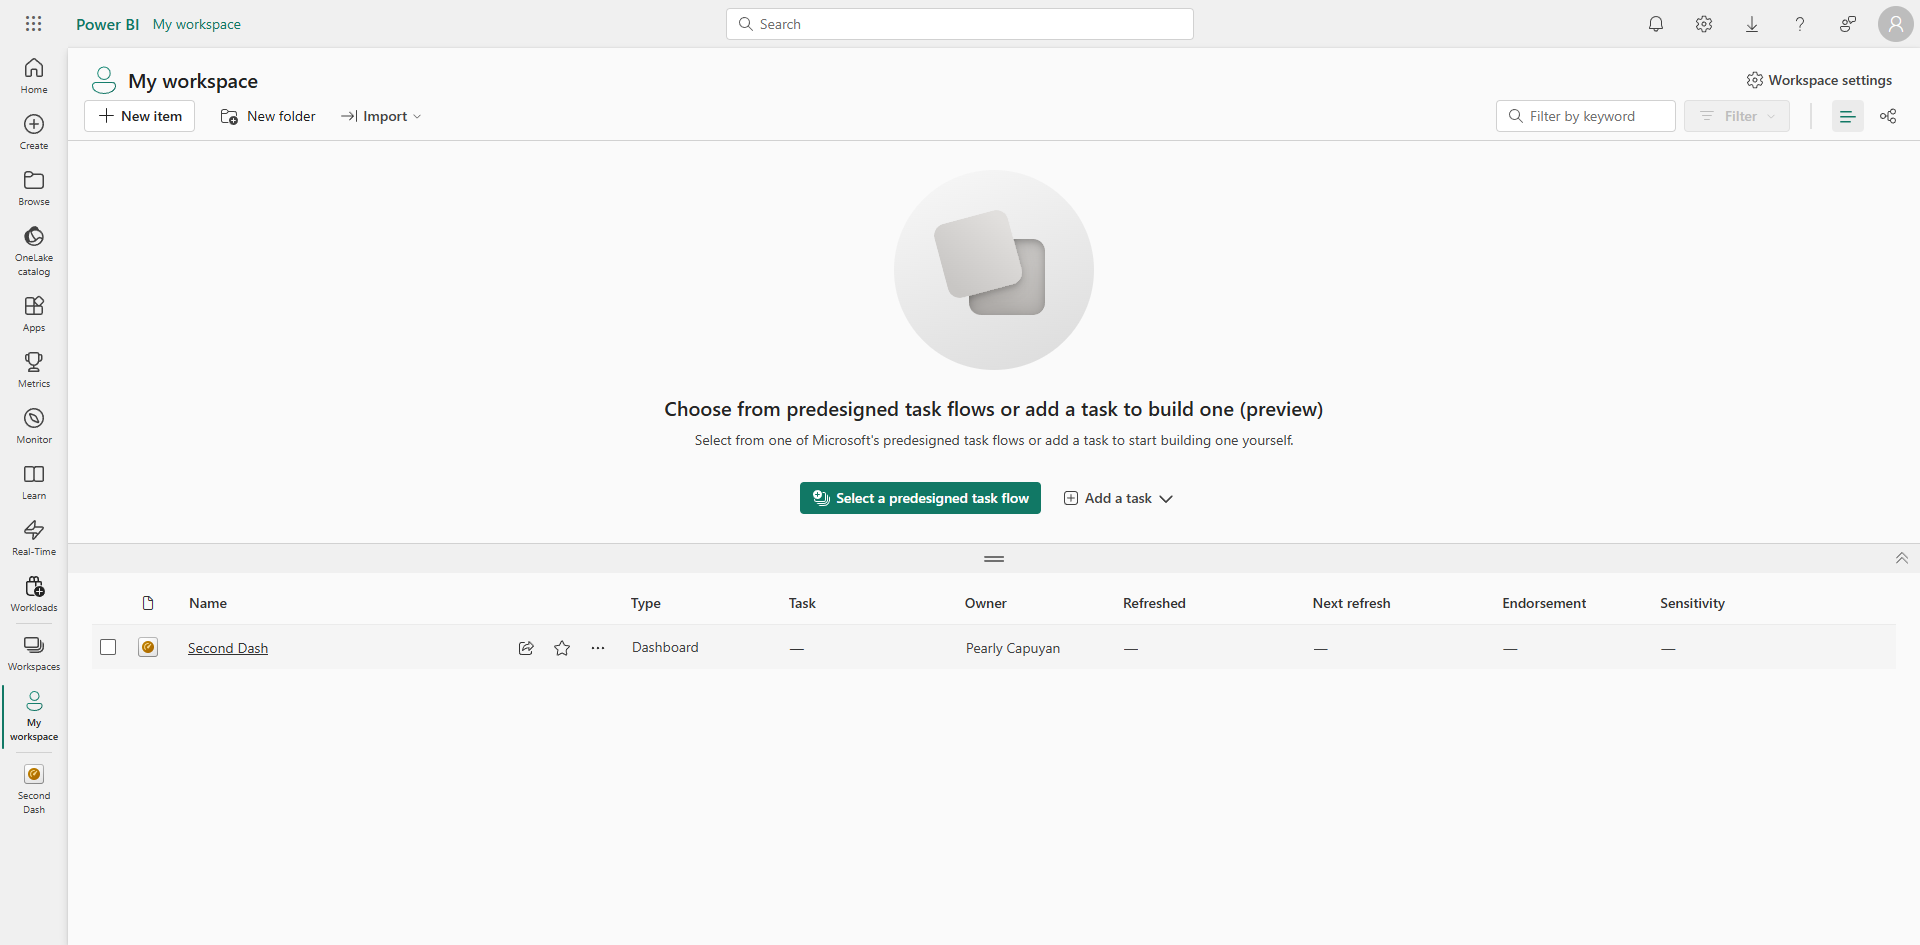
Navigate to your workspace, where we'll create a new interactive dashboard.
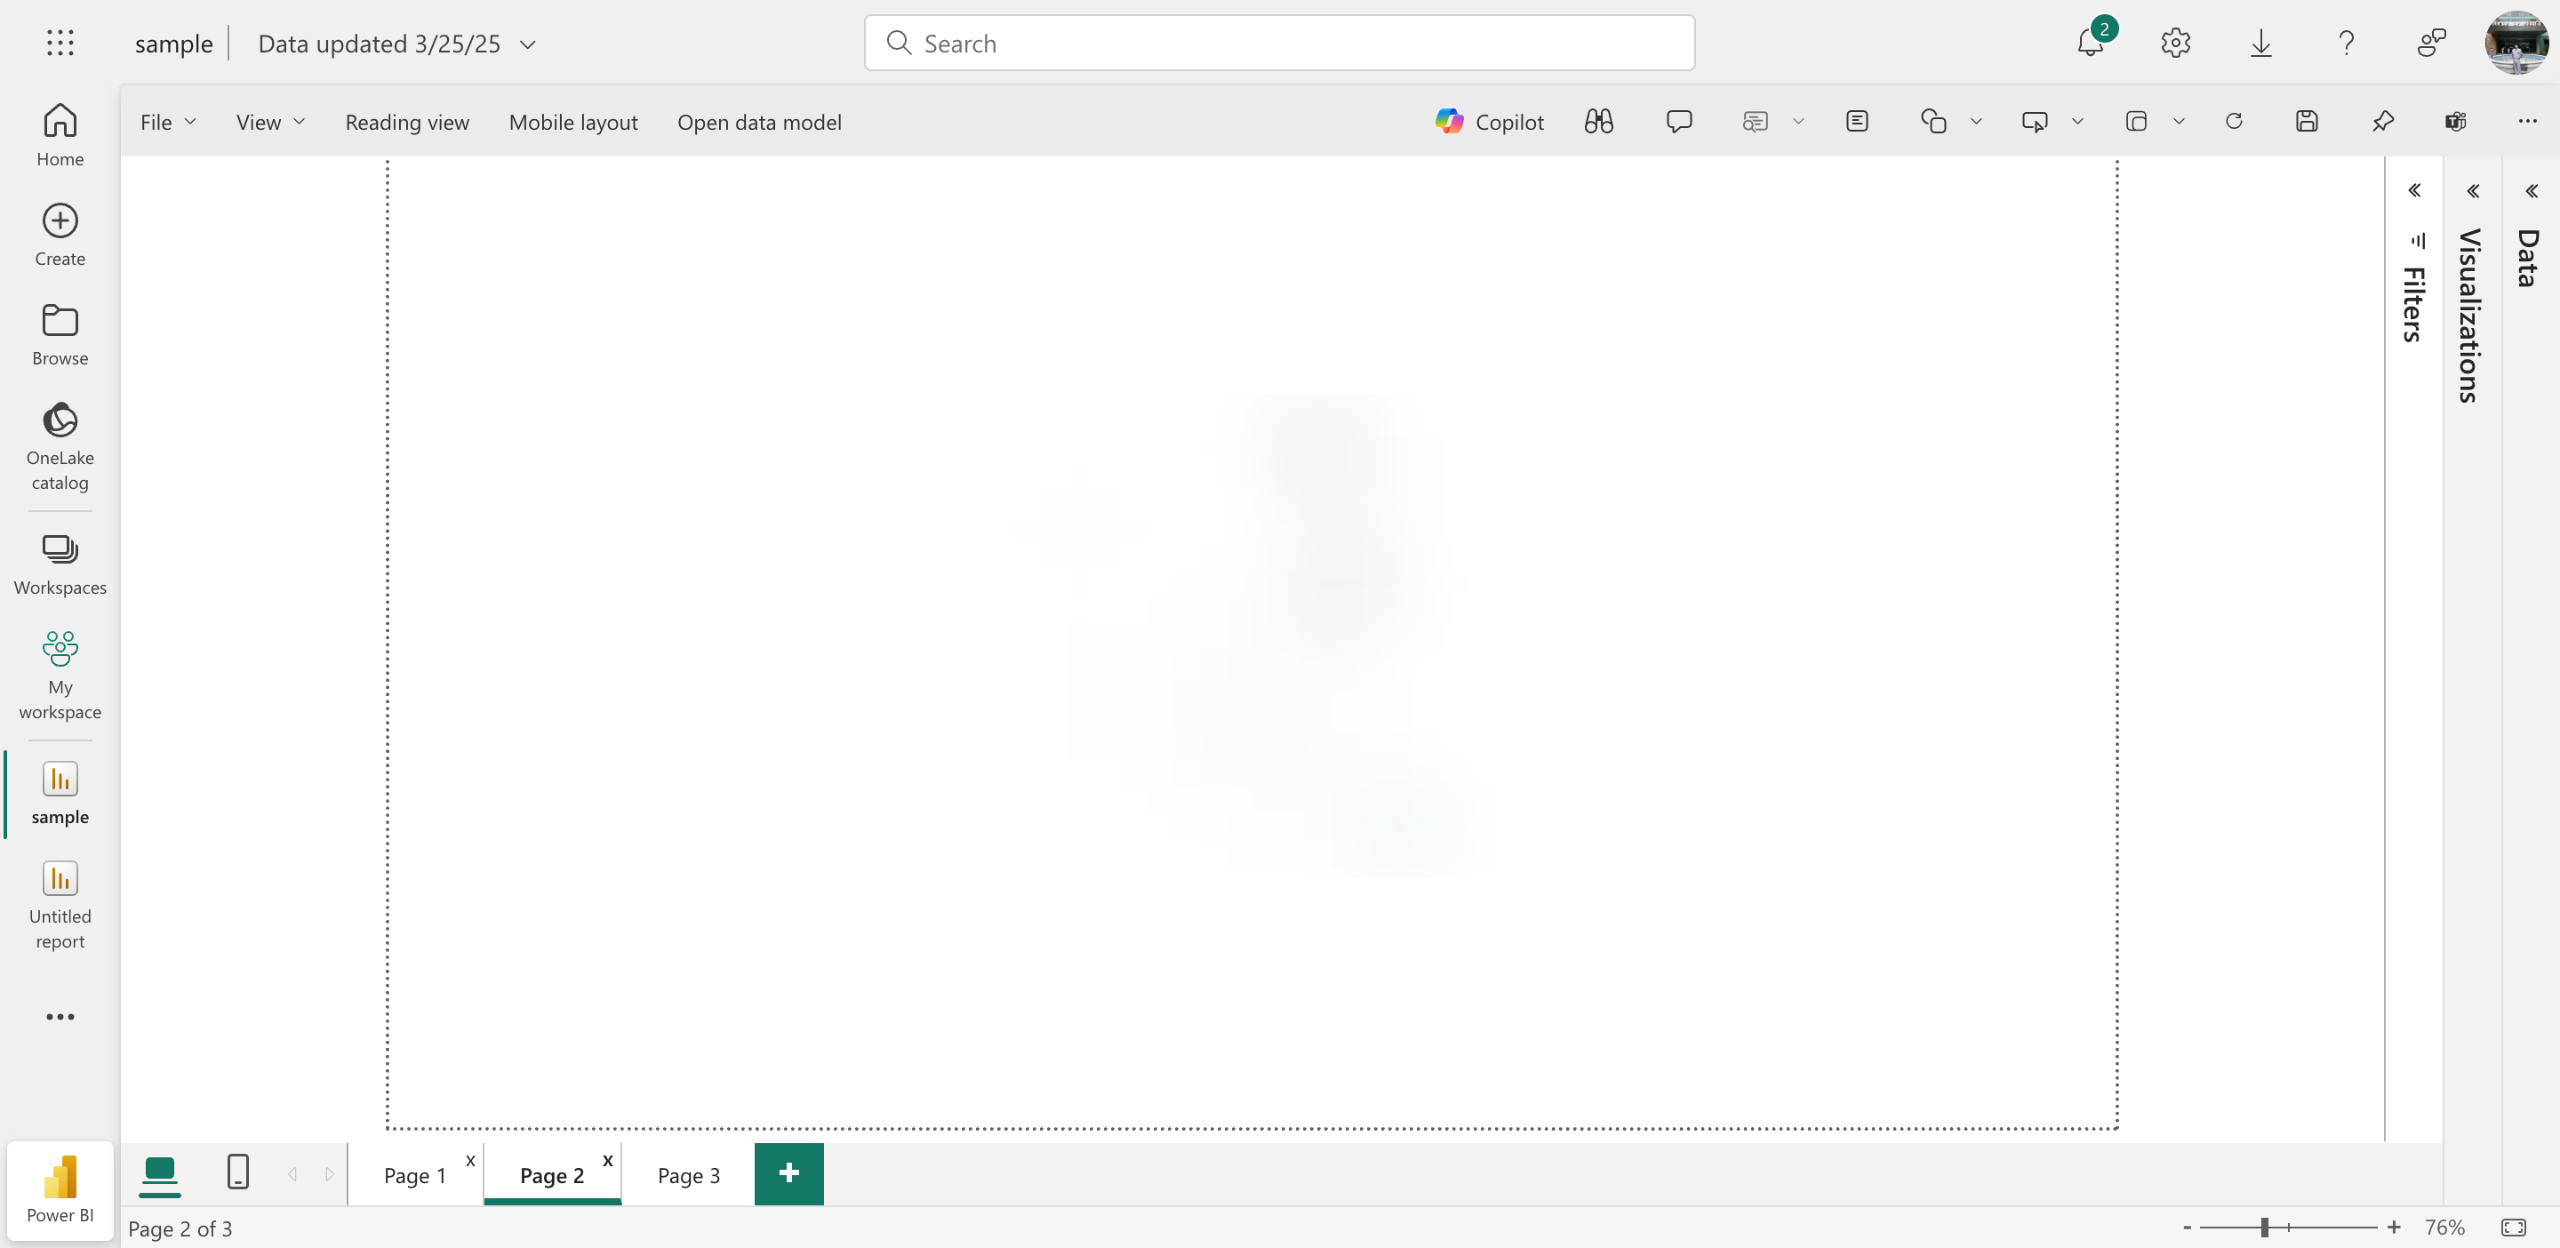
Click 'Edit' in the top-right corner.
Select 'Dashboard theme' to begin your visualization journey.
Select a theme based on your needs.
Click 'Save' to apply.
Click '+ Add a tile' to start populating your dashboard with visualizations from your reports.
Consider adding different visualization types like images, videos and text box.
Select the 'Text box' option to add explanatory notes or highlight key insights on your dashboard.
Click 'Next ' to proceed.
Decide where to put the title and adjust its position.
Provide a name for your tile.
Add a subtitle.
Configure your content and format.
Add your context.
Set a custom link for your dashboard to make it more interactive.
Click 'Apply' to publish your interactive dashboard with colleagues or stakeholders.
Quick answer: To design a dashboard in Power BI, navigate to your workspace, click 'Edit', and select a dashboard theme. Next, click '+ Add a tile' to include visualizations like a text box. Configure your content, add a custom link, and click 'Apply' to publish your interactive dashboard.
About this Power BI tutorial
Create and publish an interactive dashboard in Power BI by selecting themes, adding visual tiles, and configuring content. This guide shows how to design a Dashboard in Power BI in 16 steps, starting with "Navigate to your workspace, where we'll create a new interactive dashboard" and finishing with "Click 'Apply' to publish your interactive dashboard with colleagues or stakeholders". The interactive demo above is a click-through copy of the real Power BI interface, so you can rehearse each step before doing it in your own account.
Frequently asked questions
How many steps does it take to design a Dashboard in Power BI?
16 steps. Each one is listed in order above, and the demo highlights exactly where to click.
Can I try it without changing my own account?
Yes. Clicking through the demo doesn't touch your Power BI data or settings. Once you know the flow, repeat it in your own workspace.
This tutorial is filed under Power BI. Related guides: How to Display Data in Power BI, How to Display Power BI Pages and How to Display the Total Number of Records in Power BI. Last reviewed 05 Oct 2026.

Create your first interactive demo in minutes
No credit card required • Start building today