How to Set Date Ranges in Amplitude Charts
- George Apostolov
How to Set Date Ranges in Amplitude Charts: step-by-step guide
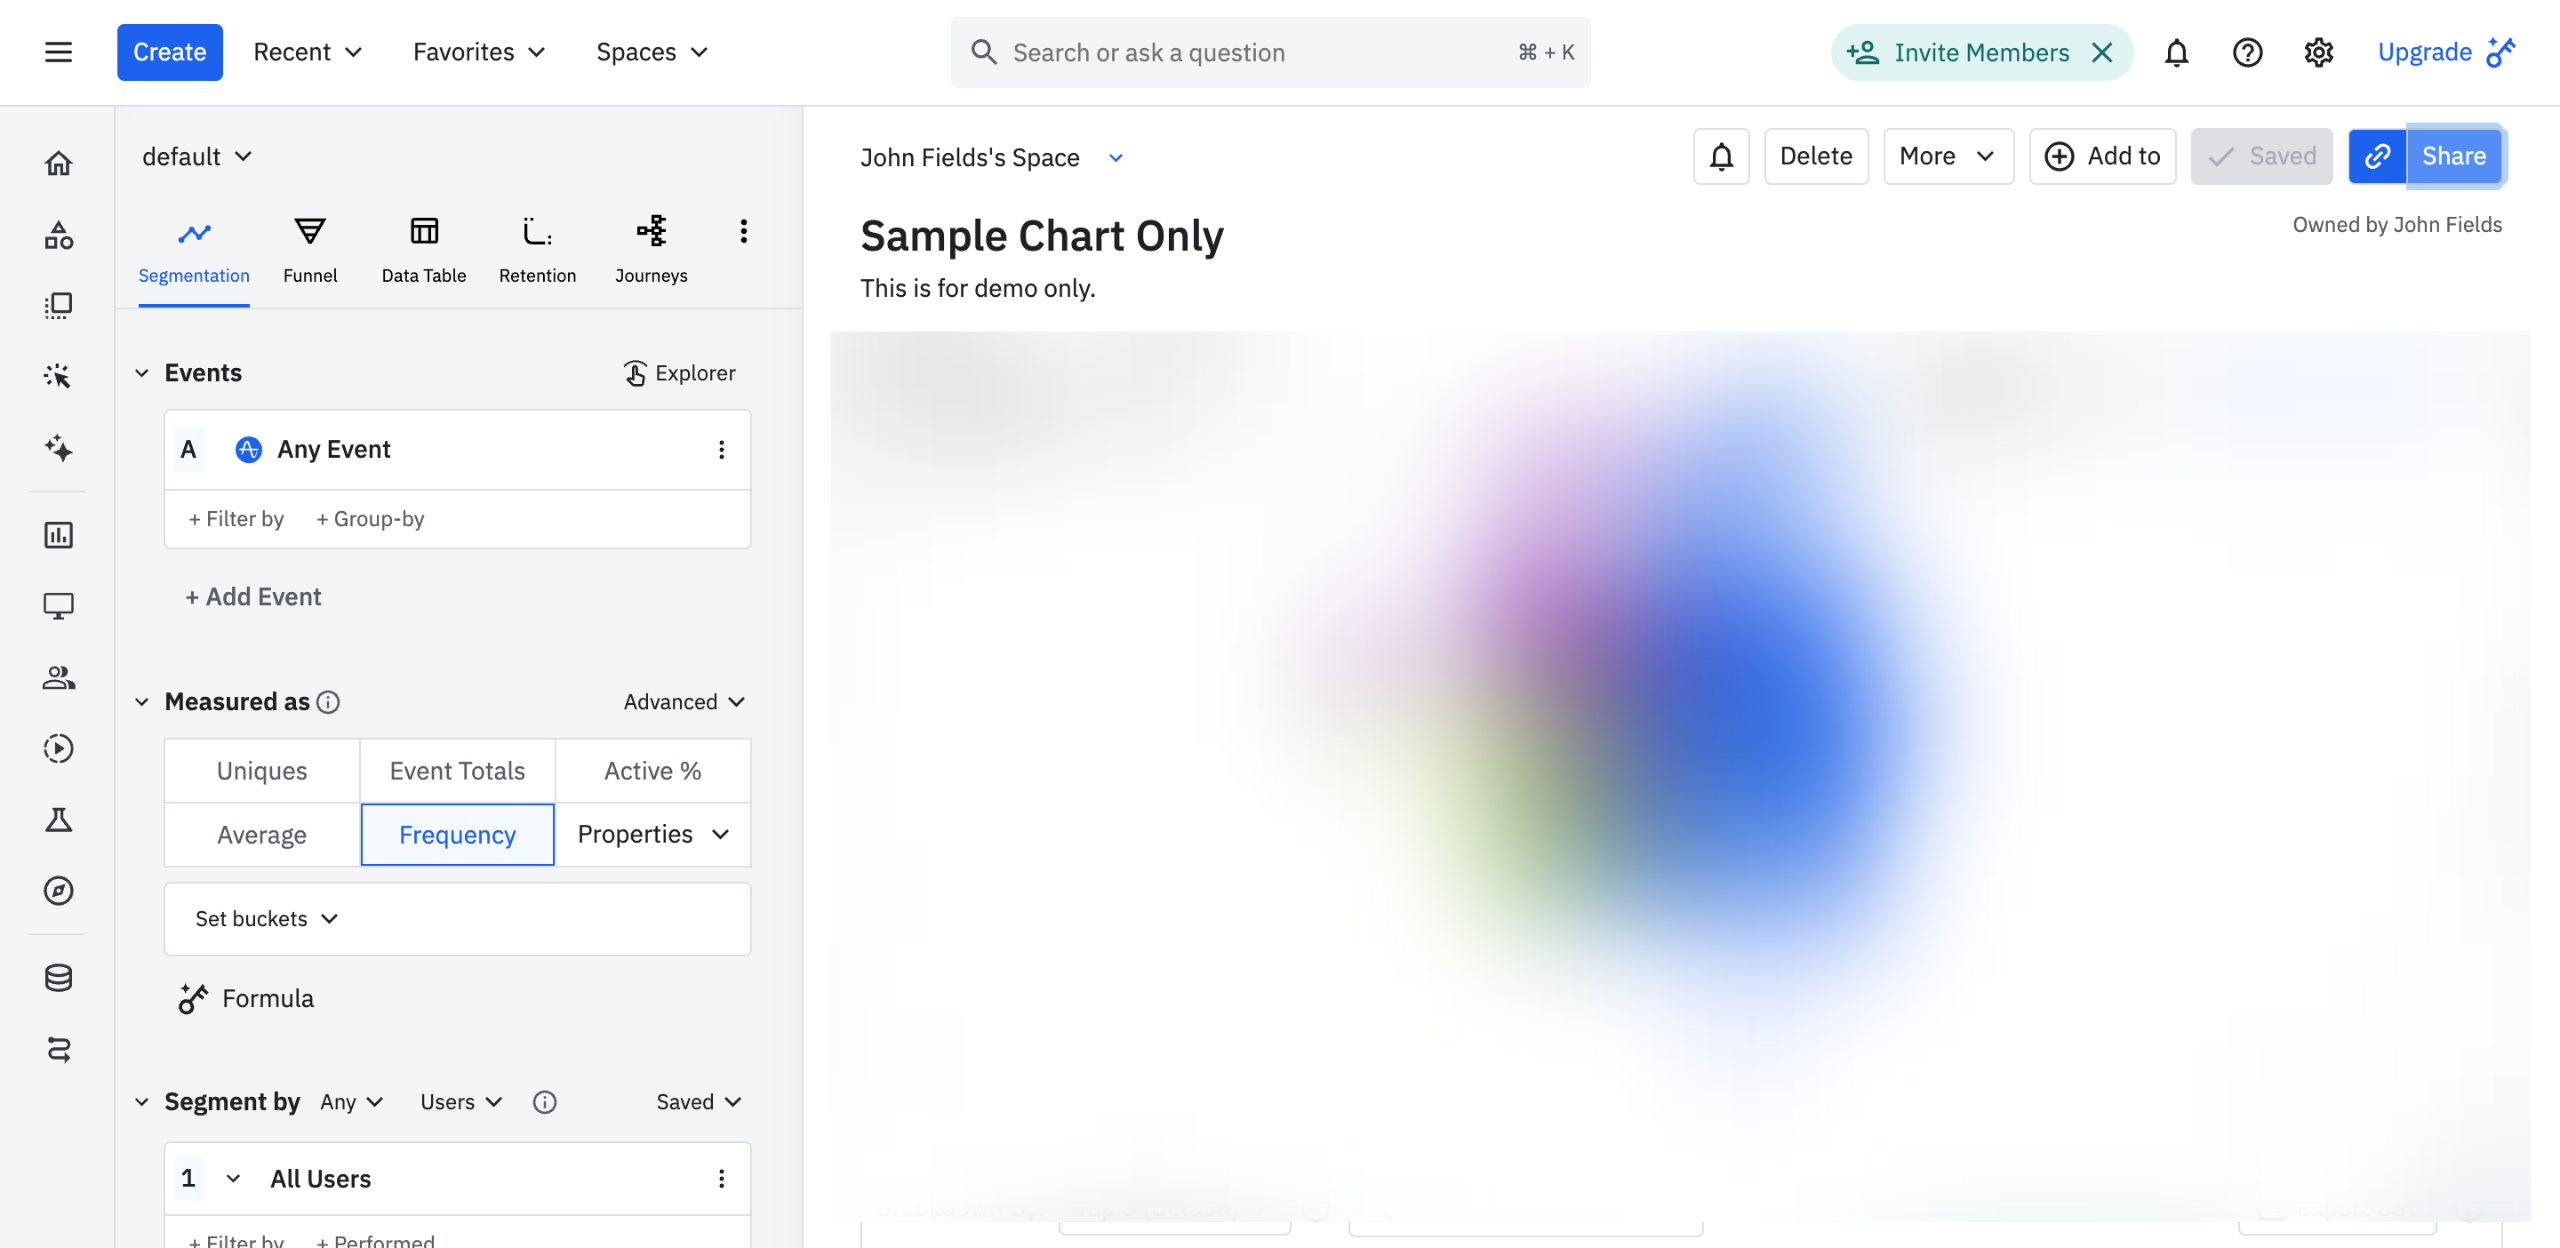
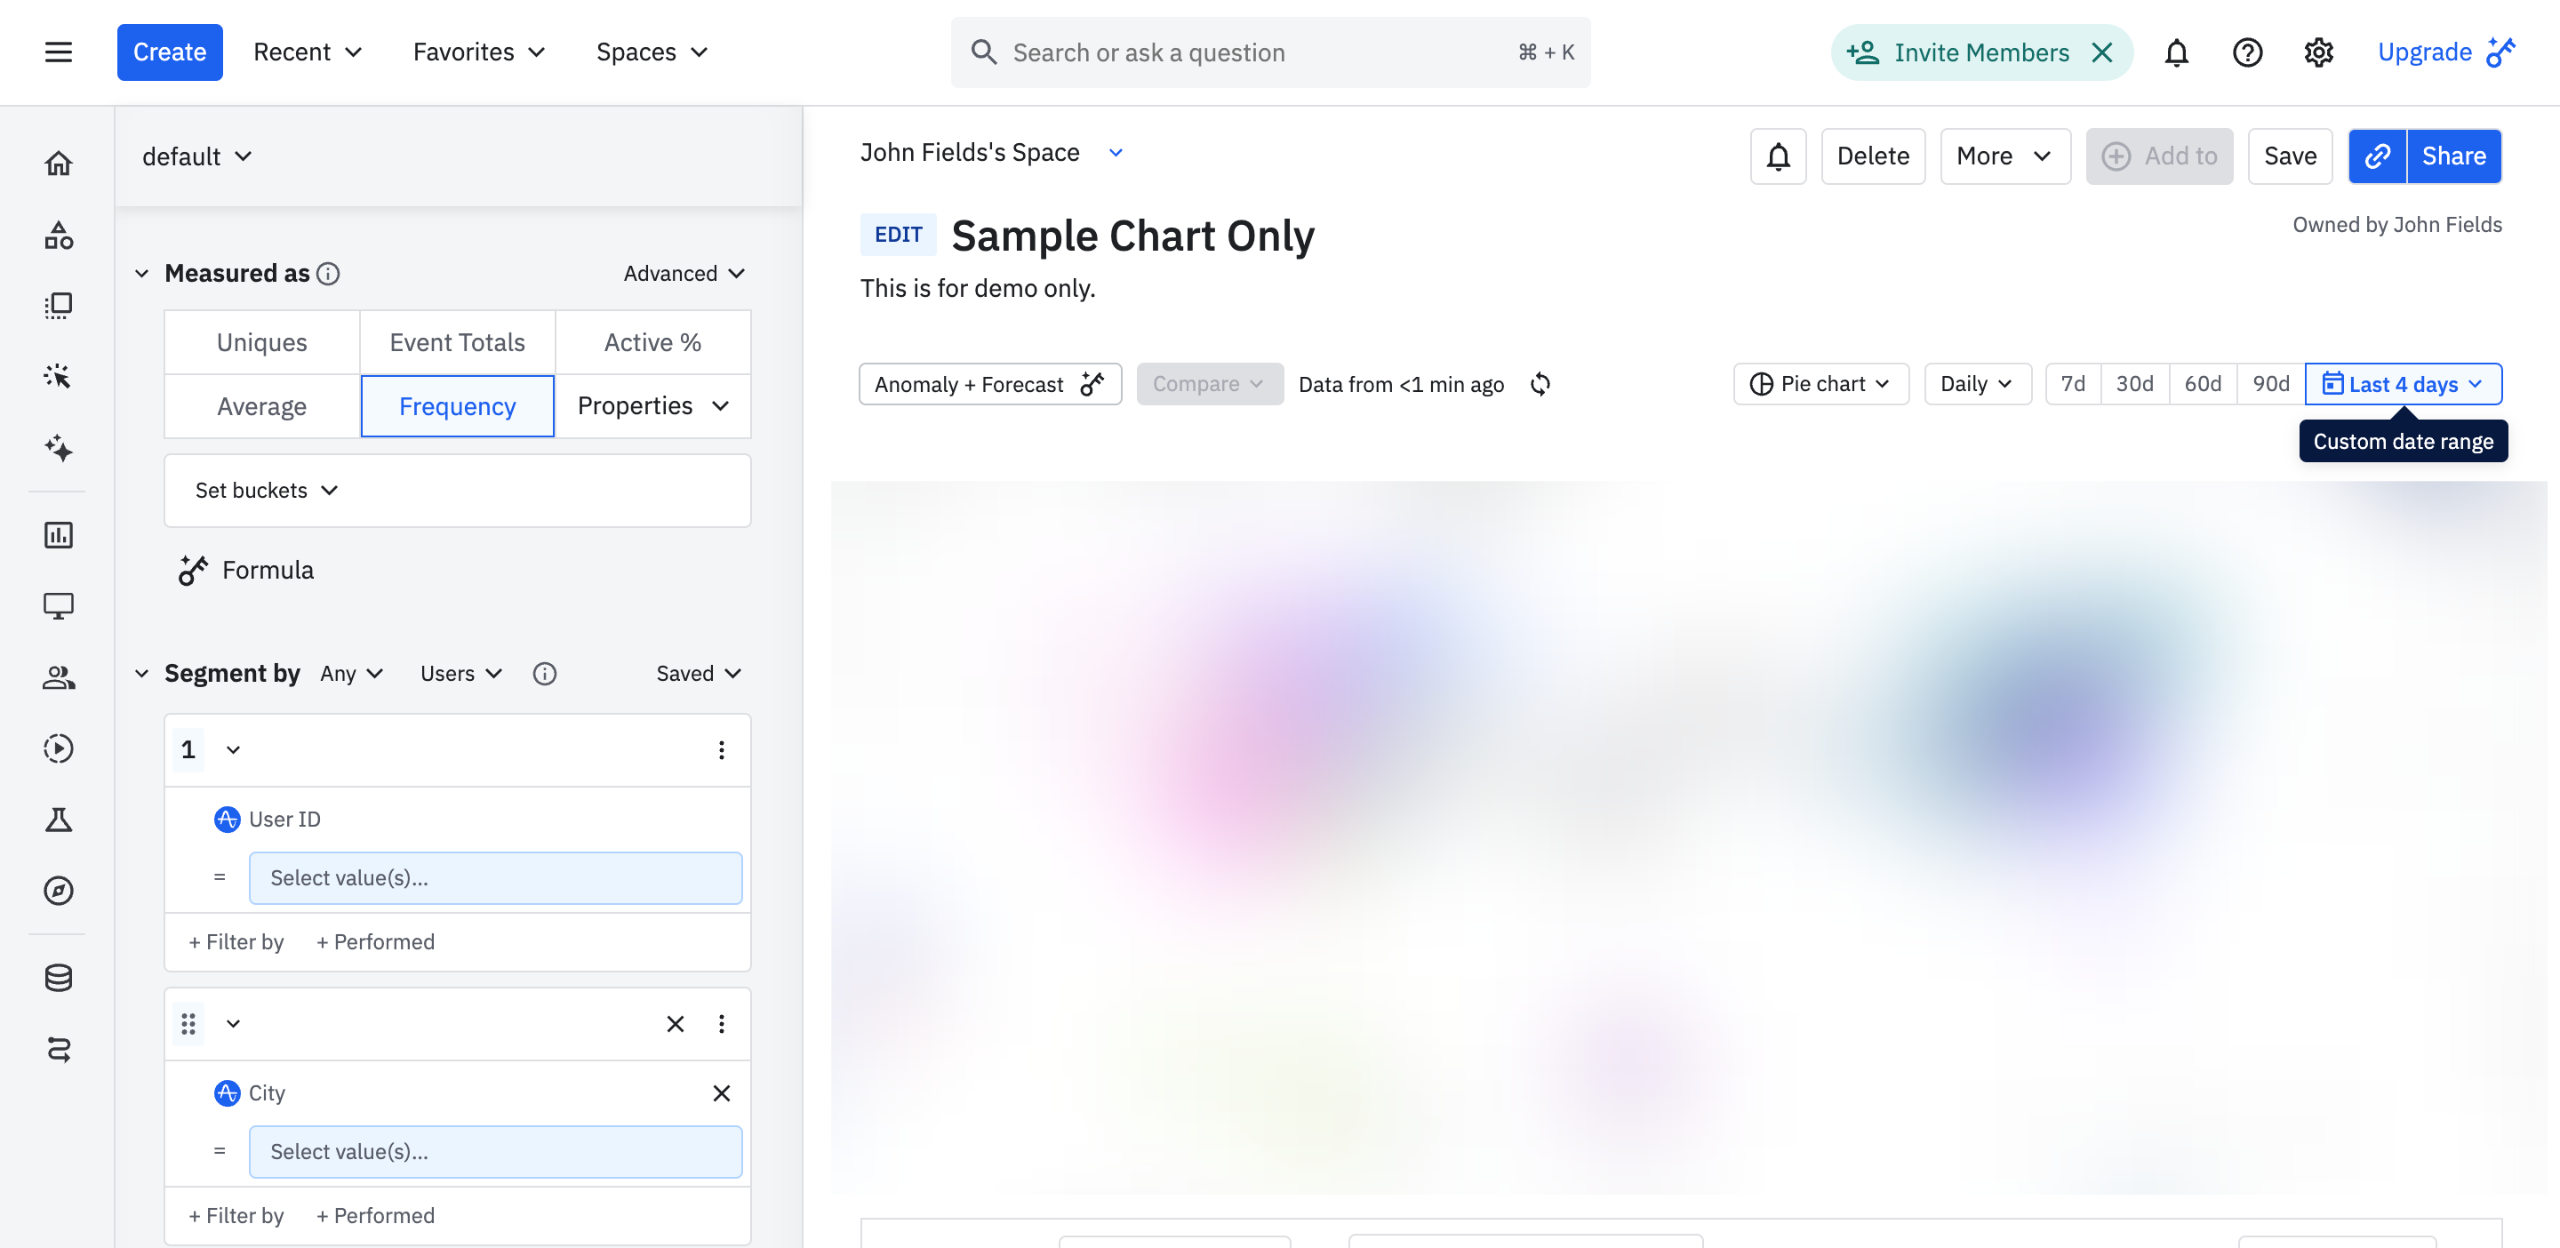
Inside Amplitude's Chart Editor, go to the top-right corner and click the 'Custom Date Range' menu.
Select 'Between' from the list of options.
After that, head over to the calendar preview and select the start date.
Subsequently, select the end date.
Once done, tap 'Apply'.
After completing these steps, the selected date ranges will be applied to your Amplitude charts.
Quick answer: To set date ranges in Amplitude charts, open the Custom Date Range menu in the Chart Editor and select Between. Then, choose your start and end dates using the calendar preview and tap Apply to update your charts with the selected range.
About this Amplitude tutorial
Apply custom date ranges to your Amplitude charts by selecting start and end dates in the Chart Editor. This guide shows how to set Date Ranges in Amplitude Charts in 6 steps, starting with "Inside Amplitude's Chart Editor, go to the top-right corner and click the 'Custom Date..." and finishing with "After completing these steps, the selected date ranges will be applied to your Amplitud...". The interactive demo above is a click-through copy of the real Amplitude interface, so you can rehearse each step before doing it in your own account.
Frequently asked questions
How many steps does it take to set Date Ranges in Amplitude Charts?
6 steps. Each one is listed in order above, and the demo highlights exactly where to click.
Can I try it without changing my own account?
Yes. Clicking through the demo doesn't touch your Amplitude data or settings. Once you know the flow, repeat it in your own workspace.
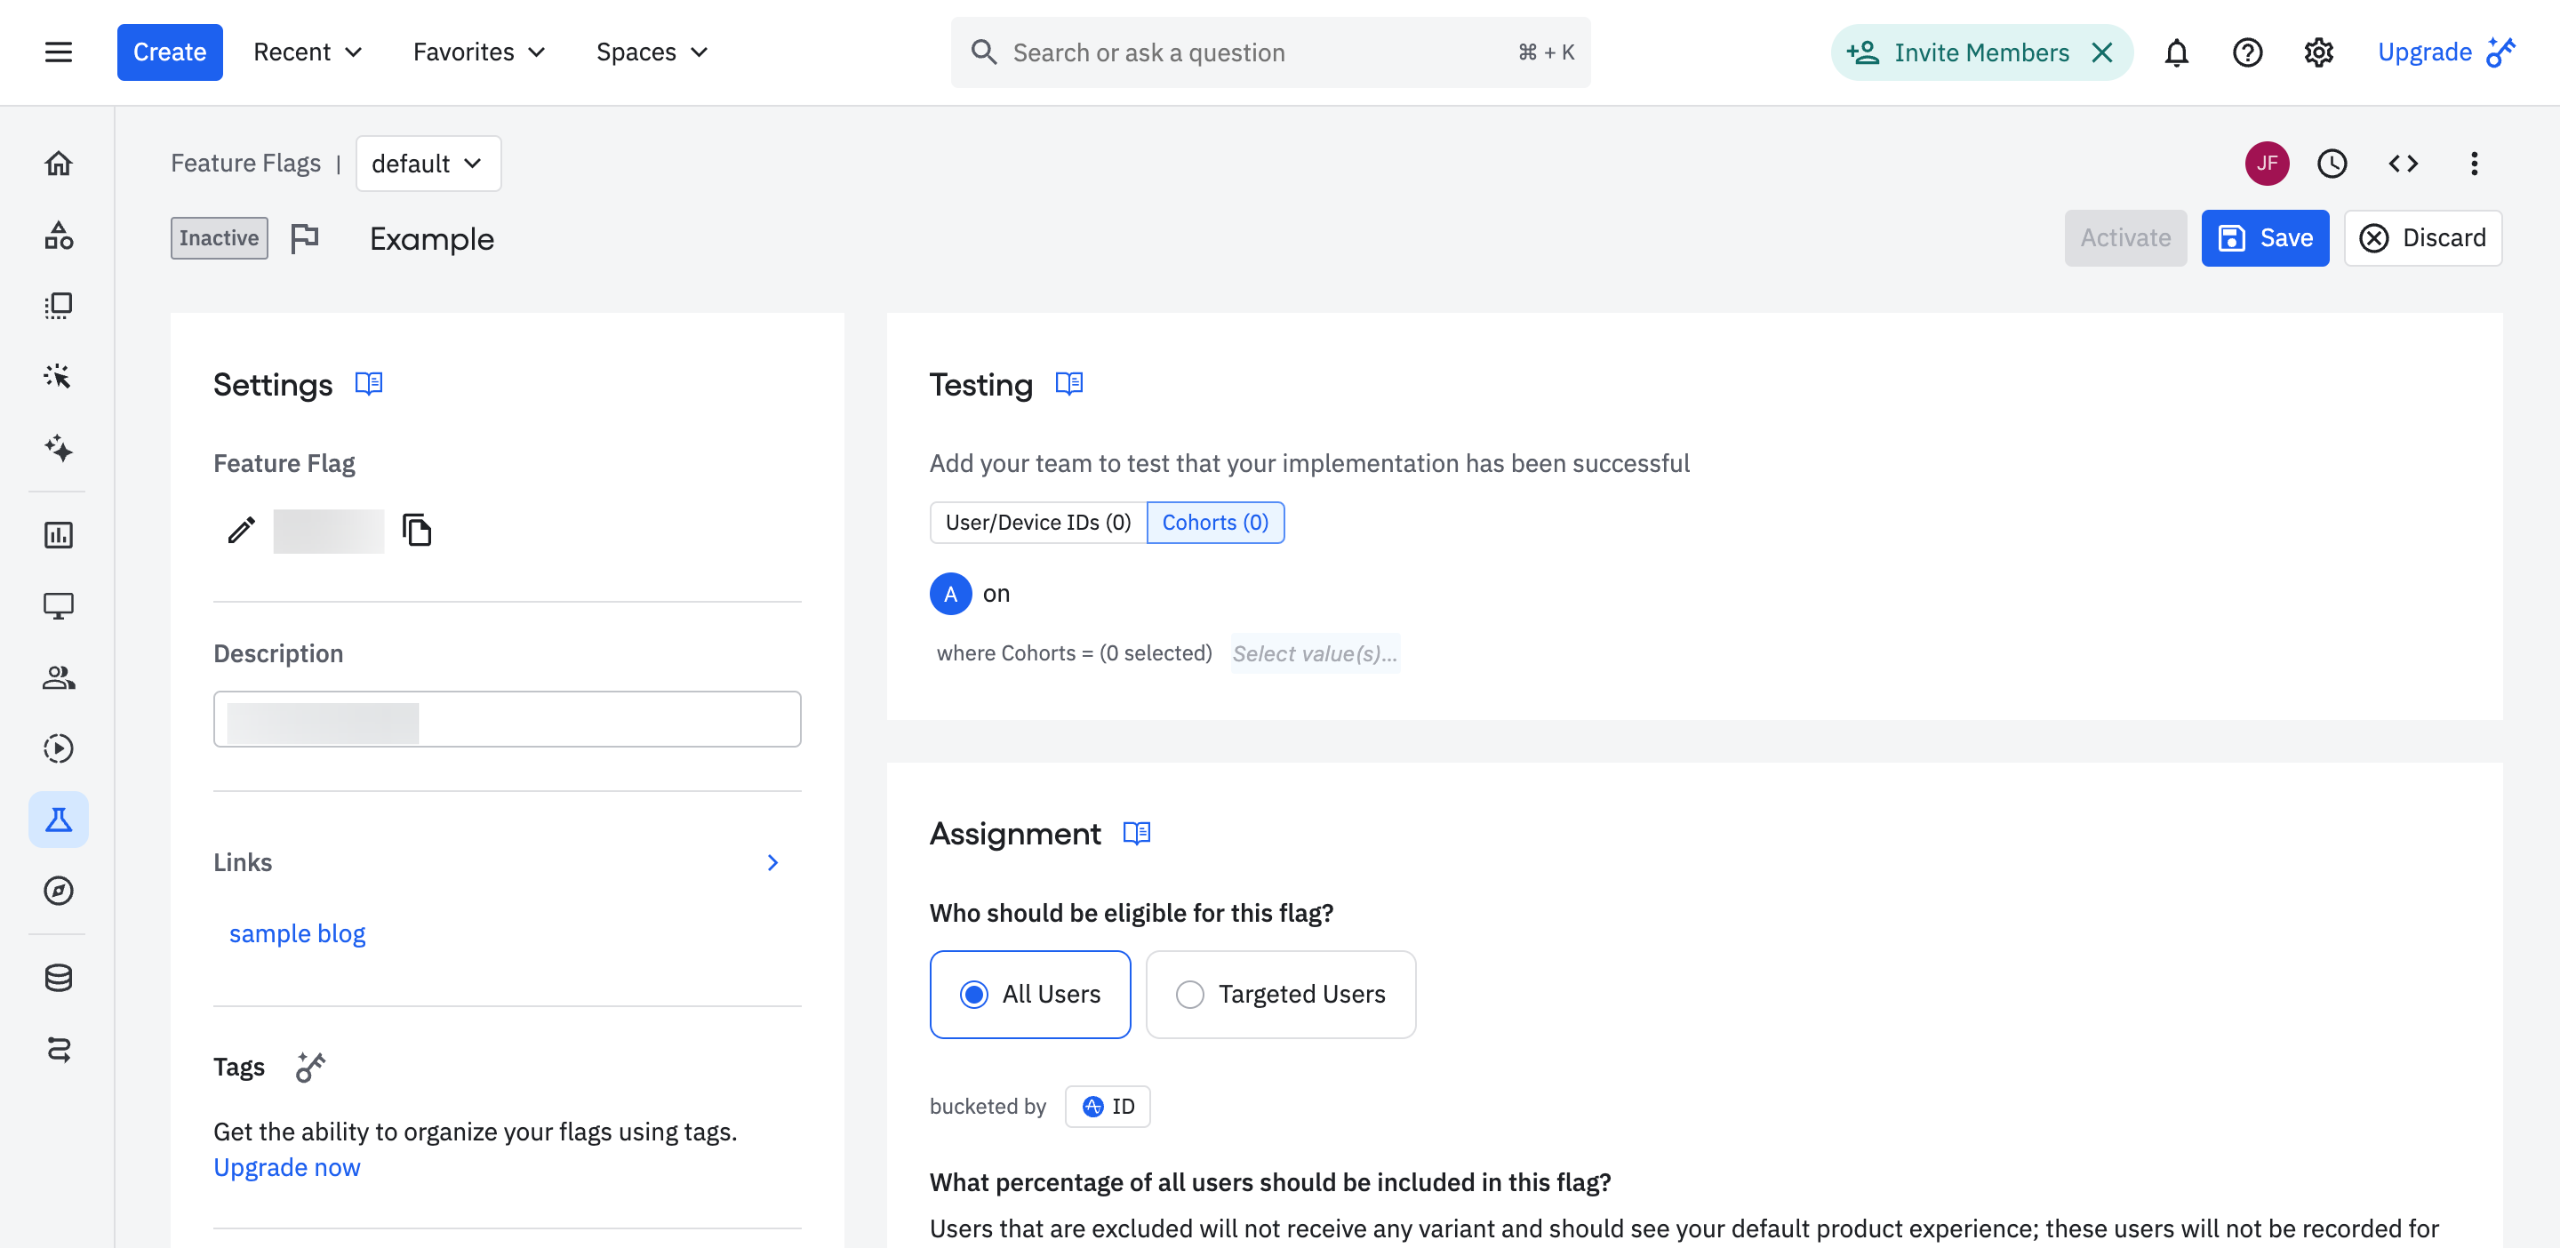
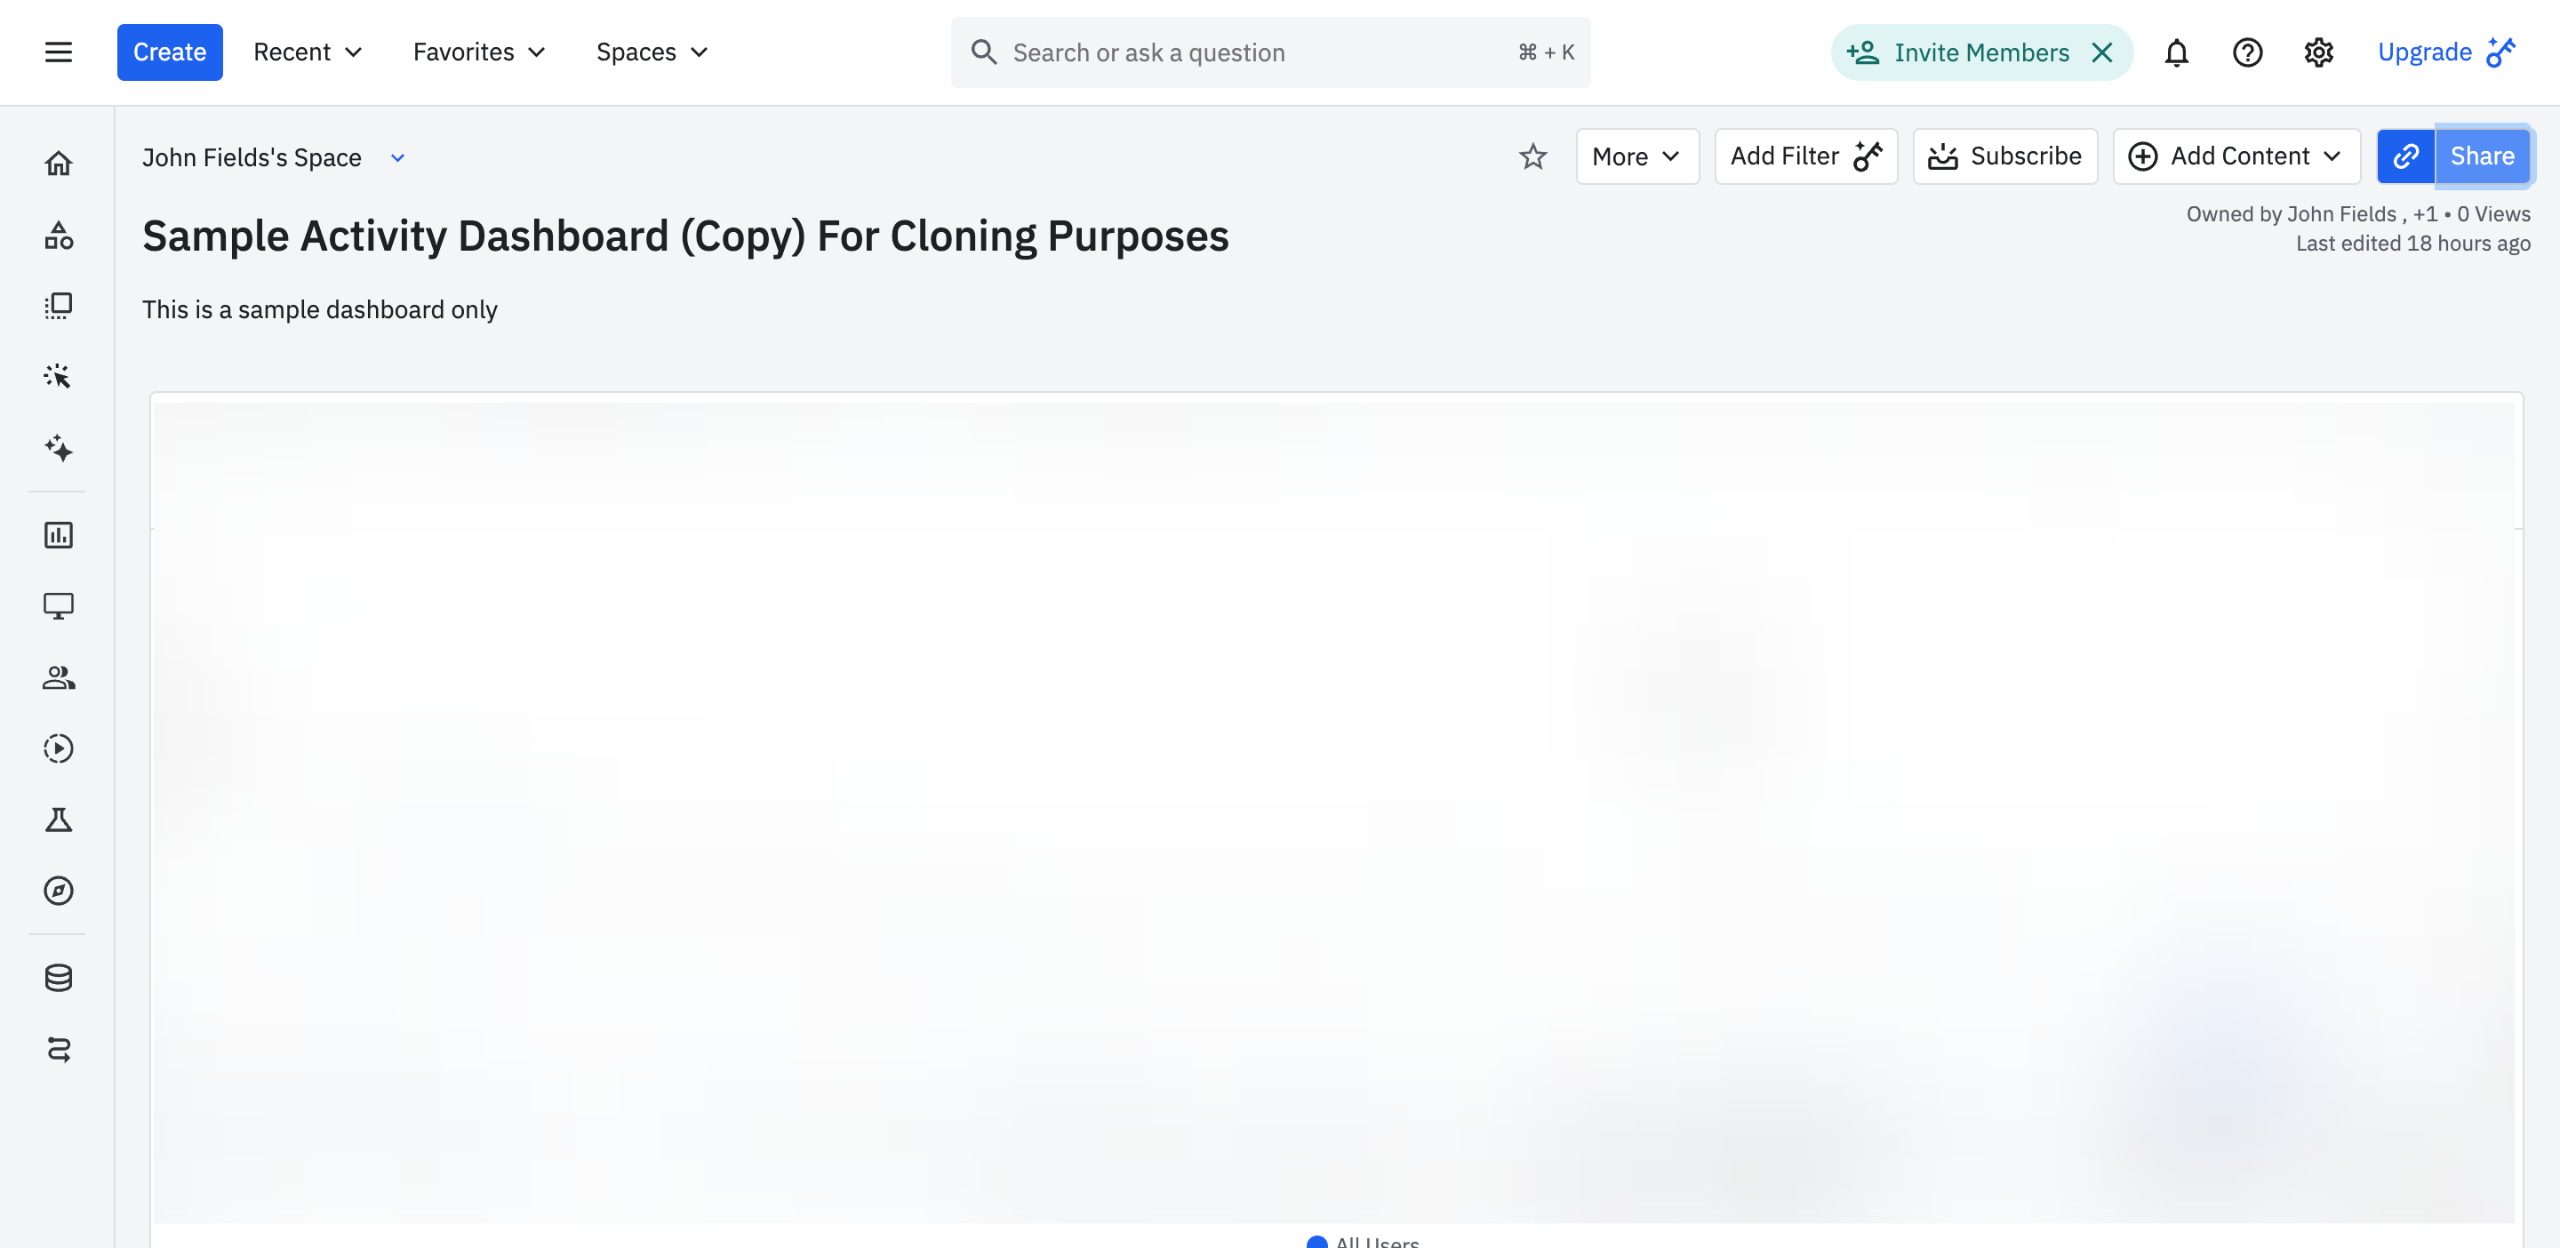
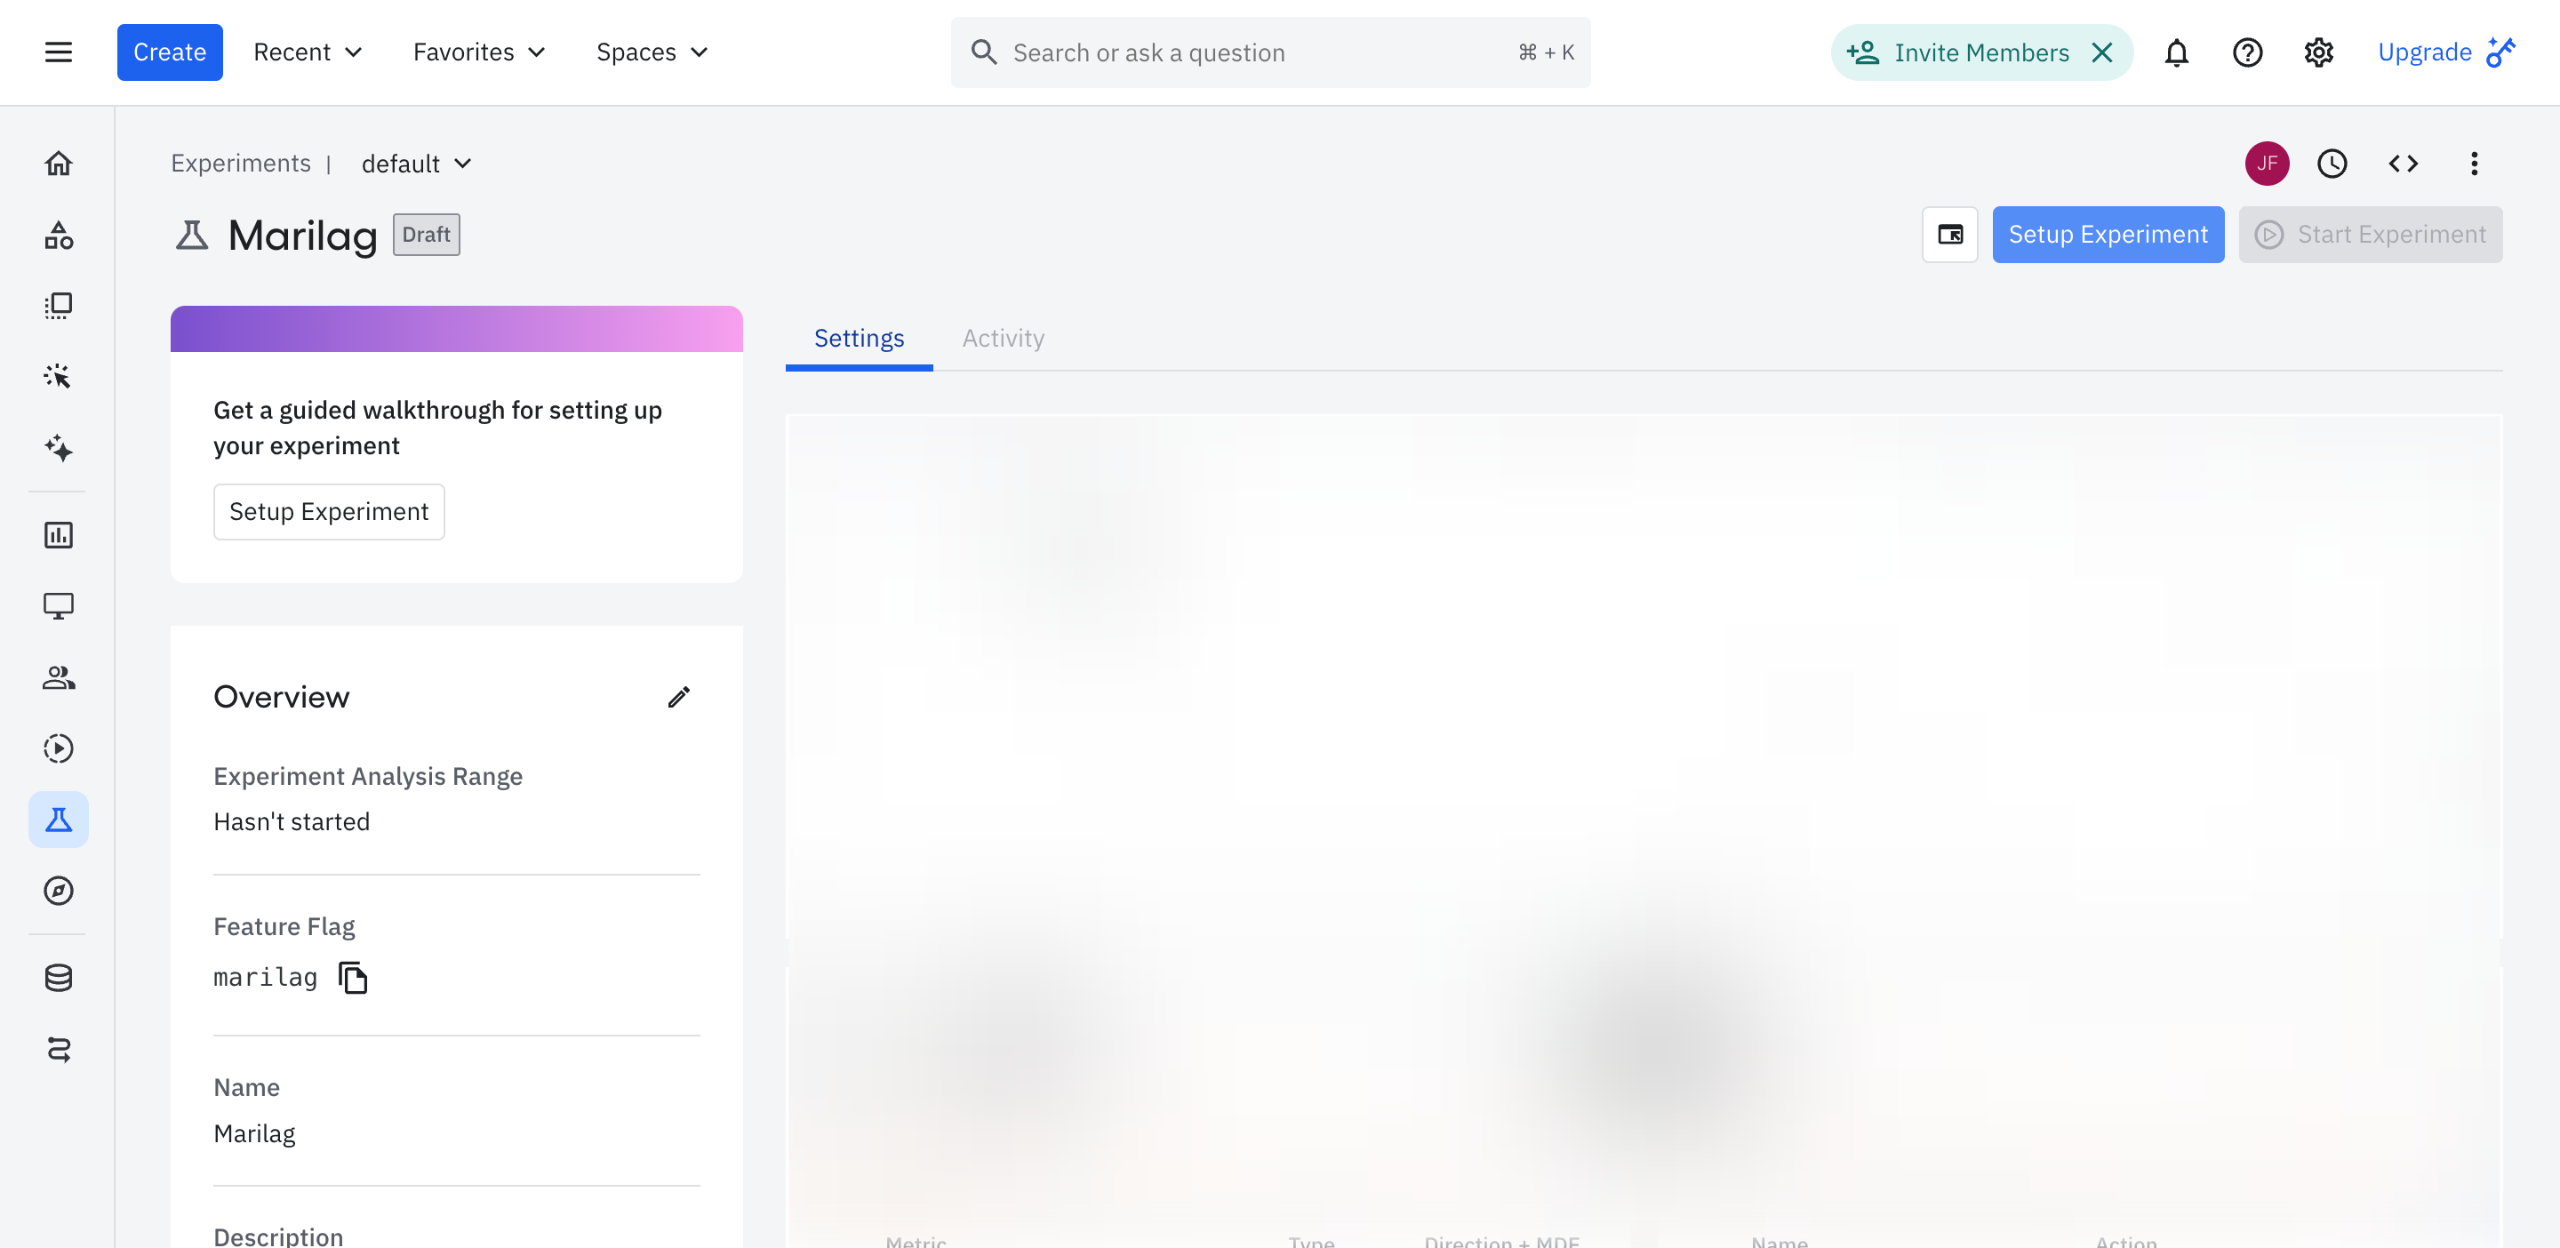
This tutorial is filed under Amplitude. Related guides: How to Set Feature Flag Rules in Amplitude, How to Set the User's Dashboard Permissions in Amplitude and How to Set Up an Experiment in Amplitude. Last reviewed 05 Oct 2026.

Create your first interactive demo in minutes
No credit card required • Start building today